

Volume 6, Issue 1 (Continuously Updated 2023)
Func Disabil J 2023, 6(1): 0-0 |
Back to browse issues page


Download citation:
BibTeX | RIS | EndNote | Medlars | ProCite | Reference Manager | RefWorks
Send citation to:


BibTeX | RIS | EndNote | Medlars | ProCite | Reference Manager | RefWorks
Send citation to:
Joolaee A, Jafarzadehpur E, Asharlous A. Body Mass Index and Ocular Accommodation Performance. Func Disabil J 2023; 6 (1) : 28.10
URL: http://fdj.iums.ac.ir/article-1-242-en.html
URL: http://fdj.iums.ac.ir/article-1-242-en.html


1- Department of Optometry, School of Rehabilitation Sciences, Iran University of Medical Sciences, Tehran, Iran.
2- Department of Optometry, School of Rehabilitation Sciences, Iran University of Medical Sciences, Tehran, Iran. ,jafarzadehpour.e@iums.ac.ir
2- Department of Optometry, School of Rehabilitation Sciences, Iran University of Medical Sciences, Tehran, Iran. ,
Full-Text [PDF 1026 kb]
(671 Downloads)
| Abstract (HTML) (1462 Views)
Full-Text: (659 Views)
Introduction
The body mass index (BMI) is an anthropometric parameter measurement derived from the square root of weight and height. It is defined into four distinct categories, obese, overweight, normal, and underweight; it indicates the body’s condition concerning thinness and obesity.
According to research conducted in Iran between 2015 and 2023, the prevalence rates of obesity and underweight among adults aged 18 years and above were 21.7% and 17%, respectively. These results highlight the crucial importance of both obesity and thinness [1, 2].
Due to its simplicity and accessibility, measuring BMI has emerged as a viable approach to examining physical body composition and evaluating overweight or underweight individuals [3].
Consequently, many investigations have attempted to investigate the correlation between it and the possibility of playing as a risk factor for the well-being of the body and its various organs.
The concept mentioned earlier also applies to the eyes, and recent research has studied its correlation with eye and vision health. Research results have shown a significant relationship between elevated BMI and increased risk of age-related ocular conditions, including macular degeneration and cataracts. Previous studies have shown a significant correlation between BMI and susceptibility to ocular disorders [4, 5]. Moreover, previous research has shown a correlation between the cup-to-disc ratio and BMI. This result indicates that people with a lower body mass index (BMI) have a higher cup-to-disc ratio and an increased susceptibility to visual abnormalities [6, 7].
Accommodation is the ability of the eye to maintain a clear image of the retina at different distances. It is assessed through maximum power, dynamic, and response accuracy measures. A satisfactory performance in these components results in comfortable and clear vision. At the same time, dysfunction in these parameters can manifest as eye fatigue, lack of focus, occasional blurriness in near vision, and headaches [8].
Moreover, due to the substantial correlation shown in recent studies between accommodative performance and myopia progression, increased emphasis is placed on the need to examine accommodation function [9, 10].
Previous studies have shown limited results about the correlation between accommodation and BMI. In one of these investigations, reduced amplitude accommodation was associated with increased BMI [11].
Another study investigated accommodation and concluded that it affects amplitude accommodation in both overweight and underweight individuals but does not have a significant impact on accommodation facility and response accuracy [12].
In the research conducted by Momeni, a reduced level of convergence was observed when the BMI decreased [13]. This discovery is significant due to the strong correlation between convergence and accommodation.
Despite previous studies, no comprehensive research has been conducted in this field. The primary aim of this research is to investigate whether accommodation components vary according to BMI. When addressing this inquiry, a novel perspective arises concerning the interaction between public health and lifestyle in the context of the ocular accommodation system. This understanding can be applied to the prevention and differential diagnosis of visual impairments in both overweight and underweight individuals.
Materials and Methods
The current study is cross-sectional research conducted at the Serita Optometry Clinic, a privately-owned center in Tehran Province, from January 2021 to October 2022. A total of 168 people aged 18 to 30 years who visited this optometric clinic for an optometric examination were included in the research after considering the inclusion and exclusion criteria.
The inclusion criteria included individuals within the age range of 18 to 30 years who demonstrated full cooperation during tests, best corrected visual acuity of 20.25 or higher at a distance of 6 meters and 40 centimeters, no strabismus or a prior history of strabismus surgery, and no record of head injury or eye trauma.
The exclusion criteria included participants who exhibited intermittent or consistent strabismus with refractive errors of hyperopia or myopia that were not greater than six diopters showed abnormalities in the retina, vitreous, crystalline lens, or cornea, unable to cooperate in the testing procedures, neurological or systemic muscular conditions, metabolic disorders, followed to a specific dietary plan, or engaged in regularly physical activity.
Refraction and preliminary exams were performed for both eyes. However, the accommodation evaluation was undertaken only on the right eye.
In the initial steps, weight was measured using a digital scale, and height was assessed using a meter.
Participants were asked about their physical activities and sports.
The Nidek AR 600 autorefractometer was used to assess the patient’s refraction. At least, three shots were done for each patient, and the mean value of these shots was used for further study results [14].
Subsequent subjective examinations were performed, and the refraction was determined by identifying the most plus amount resulting in optimal visual acuity. Furthermore, the red-green test was used to balance the accommodation status.
According to Dunder’s method, the push-up test was utilized to determine the amplitude of accommodation, which is the maximum capacity of accommodation. The patient’s visual acuity was first assessed using a near-chart at a distance of 40 cm. Then, the outcome of the subjective refraction was inserted into the trial frame. The patient was instructed to focus on the two lines above the visual acuity adjusted to the highest level, corresponding to a line indicating visual acuity of 20.30. Moreover, one eye was partially obstructed during the test. The chart was brought closer to the patient until visual blurring was observed. After that, the patient was asked to blink once and reassess the degree of blurriness. Once the blurring was resolved, the chart was moved closer again until blurring reappeared following a blink. A ruler measured the distance between the reported point and the trial frame at the spectacle plane. This distance is called the near-point accommodation. The amplitude of accommodation is equivalent to the reciprocal of the space above, measured in meters [8].
During the accommodation evaluation process, the patient’s subjective refraction was placed on a trial frame. A monocular test examined accommodation differentially while one eye was occluded. The patient’s near visual acuity was assessed at a distance of 40 cm using a near chart. The patient was instructed to focus on two lines above the visual acuity line that typically represents 20.30, assuming optimal near vision.
To start the test, a lens with a refractive power of +2.00 diopters was placed in front of the trial frame. The patient was instructed to indicate when the induced blur disappeared, and the visual acuity improved to the point where the 20.30 line on the eye chart became clear. Next, a lens with a refractive power of -2.00 diopters was placed in front of the trial frame, and the patient was instructed to indicate when the visual blur disappeared and clarity was restored. This iterative procedure was repeated for one minute to quantify the patient’s ability to complete cycles within one minute, regarded as the measure of accommodation facility, expressed as cycles per minute. The evaluation began using a +2.00 lens to establish an initial state of relaxation [8].
To assess and analyze the accuracy of accommodative responses, the monocular estimated method test, also known as the monocular estimation method, was used. The retinal reflex was examined using the Heine Beta 200 retinoscope. The subjective refraction of the patient was recorded in the trial frame. The patient’s visual acuity was assessed at a closer distance using a near chart positioned at a distance of 40 cm, corresponding to the patient’s usual working distance.
In statistical analysis, descriptive statistics were utilized to categorize the data. These included measures of central tendency, such as the mean, and measures of dispersion, including the standard deviation, maximum, and minimum. Analytical statistics were employed to compare the data, analyze correlation coefficients, and perform linear regression.
The SPSS software, version 26, released in 2019, was used in this research. The researchers used linear regression analysis to investigate the relationship between the accommodation characteristics and each participant’s BMI, height, and weight. Furthermore, the Pearson correlation analysis assessed the relationship between the two eyes. A significance level of <0.05 indicated a statistically significant relationship.
Results
In this study, 168 samples were examined, with 69 male individuals (41.1%) and 99 female individuals (58.9%). Table 1 presents the mean values of independent variables, such as height, weight, BMI, and age. The results showed a statistically significant correlation between the refractions of the left and right eyes (r=0.94, P<0.0001).
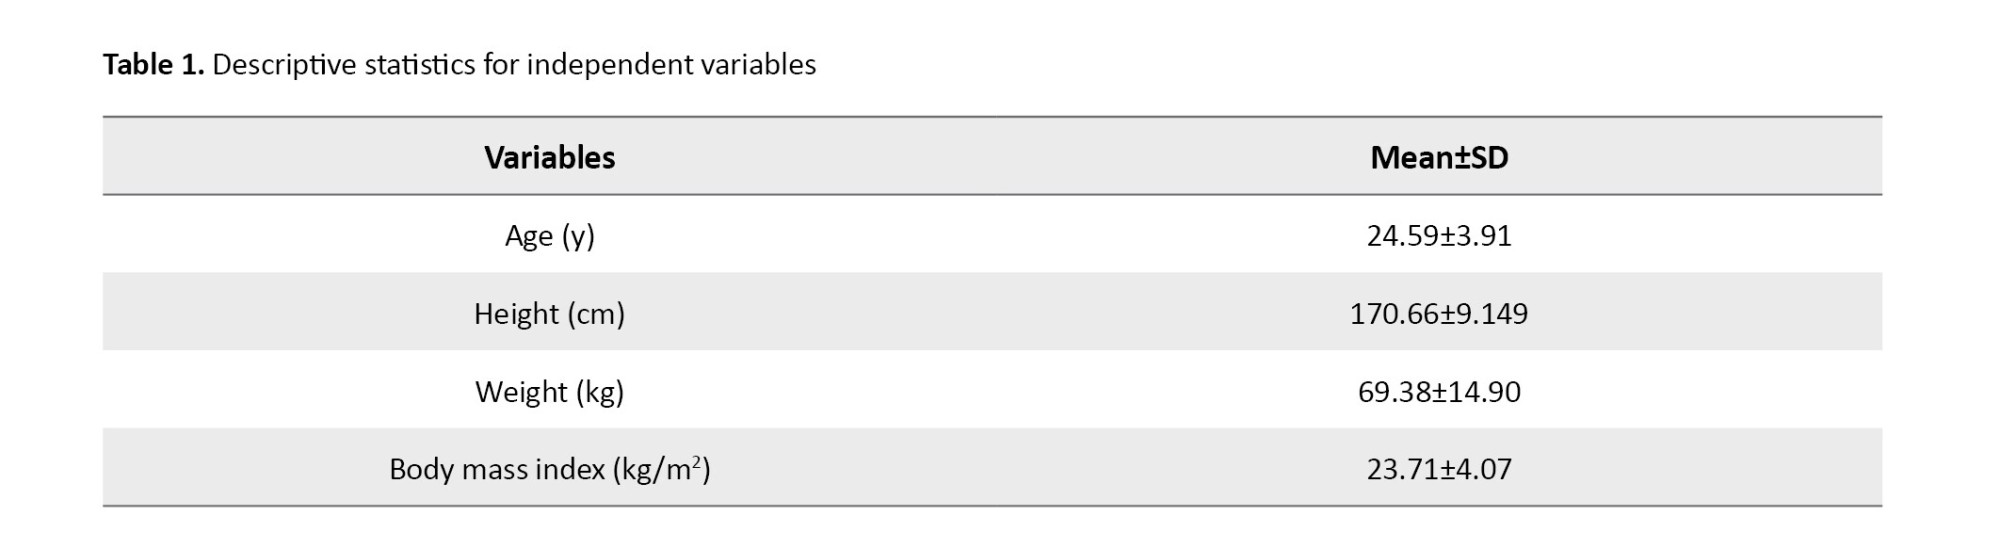
Table 2 presents the correlation between height, weight, BMI, and accommodation. The lag of accommodation has a significant correlation with height, weight, and BMI, but facility and amplitude show no significant correlation.

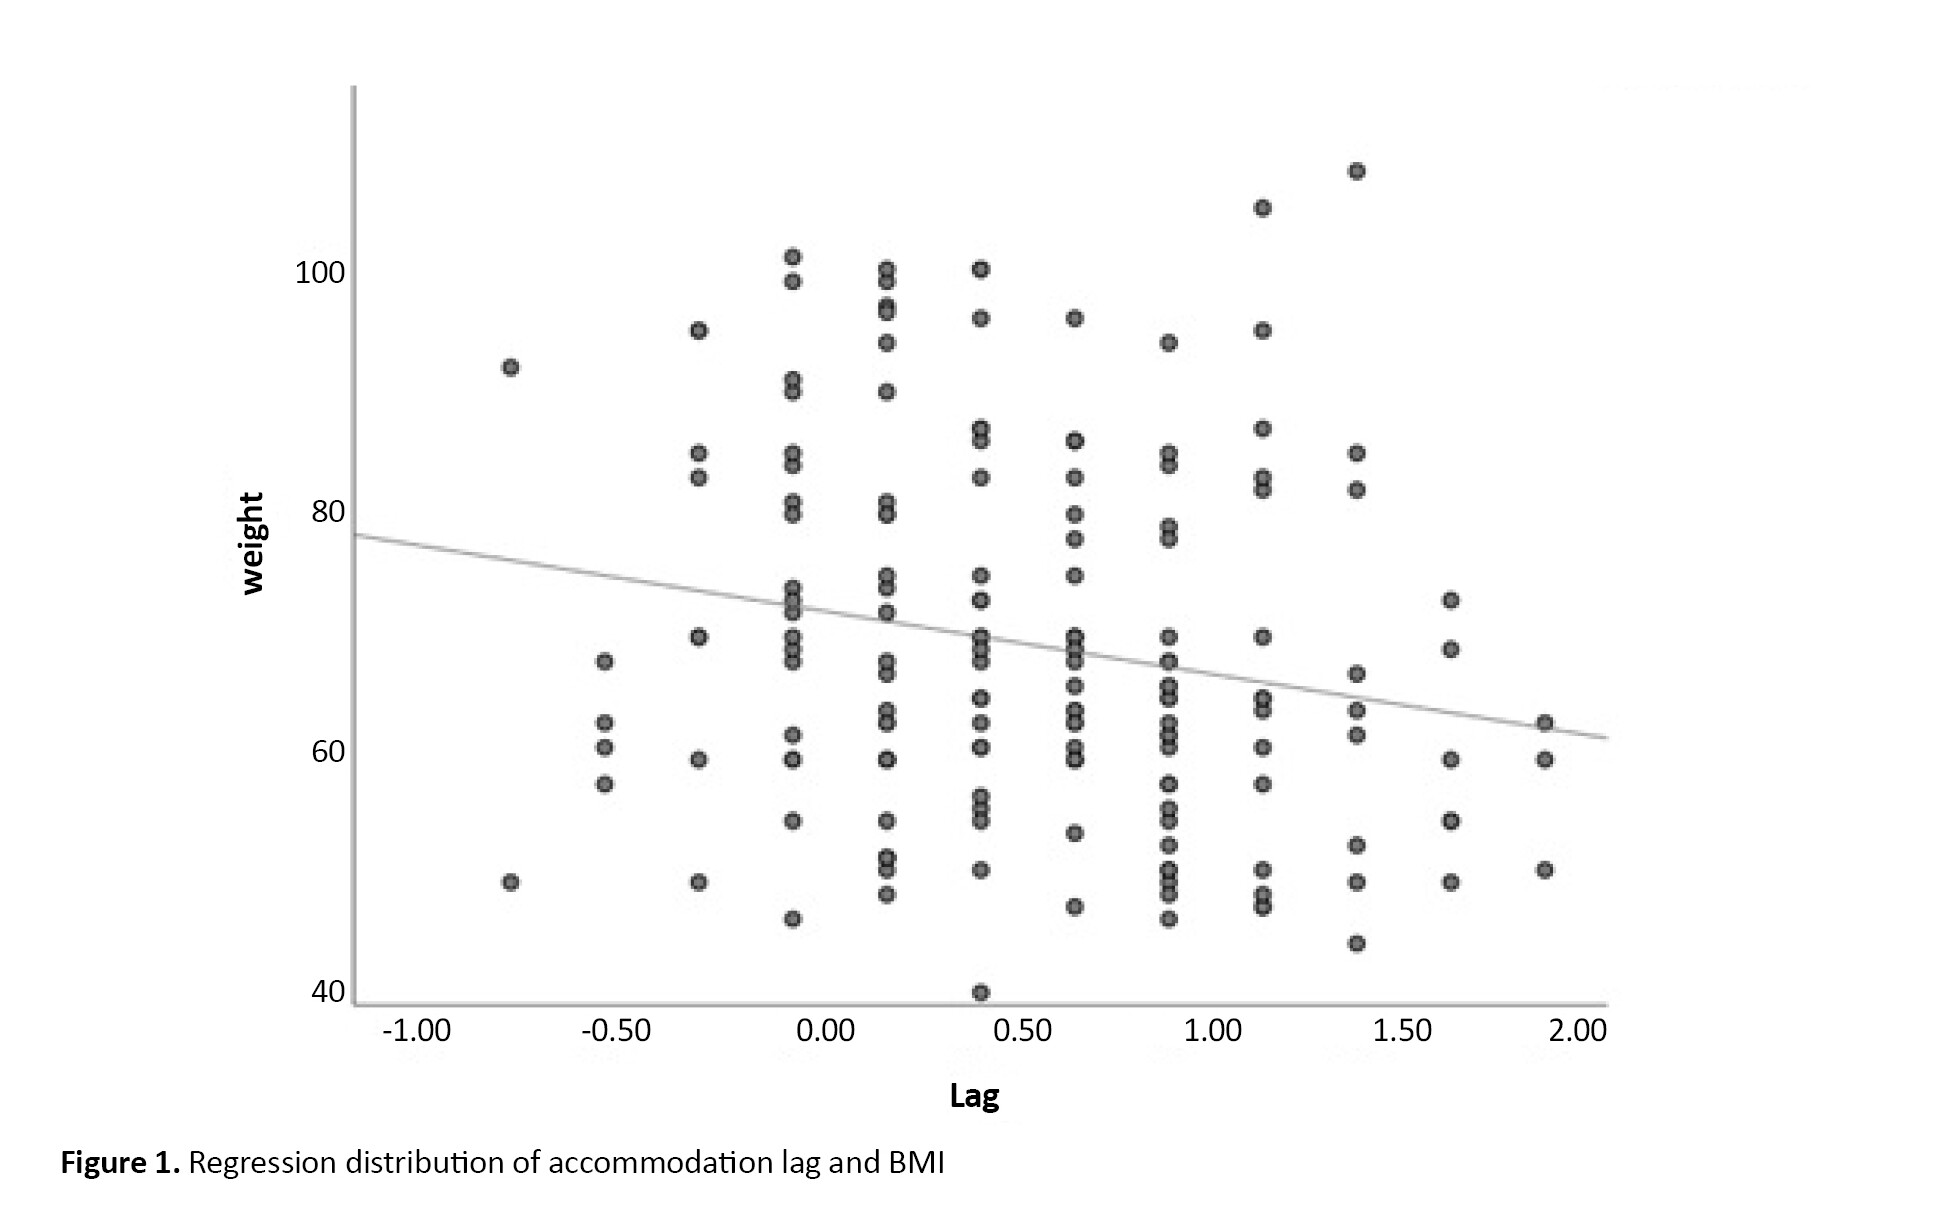
The study found a significant correlation between lag of accommodation and BMI through linear regression analysis. The results suggested an inverse relationship between BMI and lag of accommodation (R2=0.024, P=0.044). Figure 1 shows this relationship, which shows the distribution and regression line. Formula 1 is as follows:
1. Lag=1.165-0.022×BMI
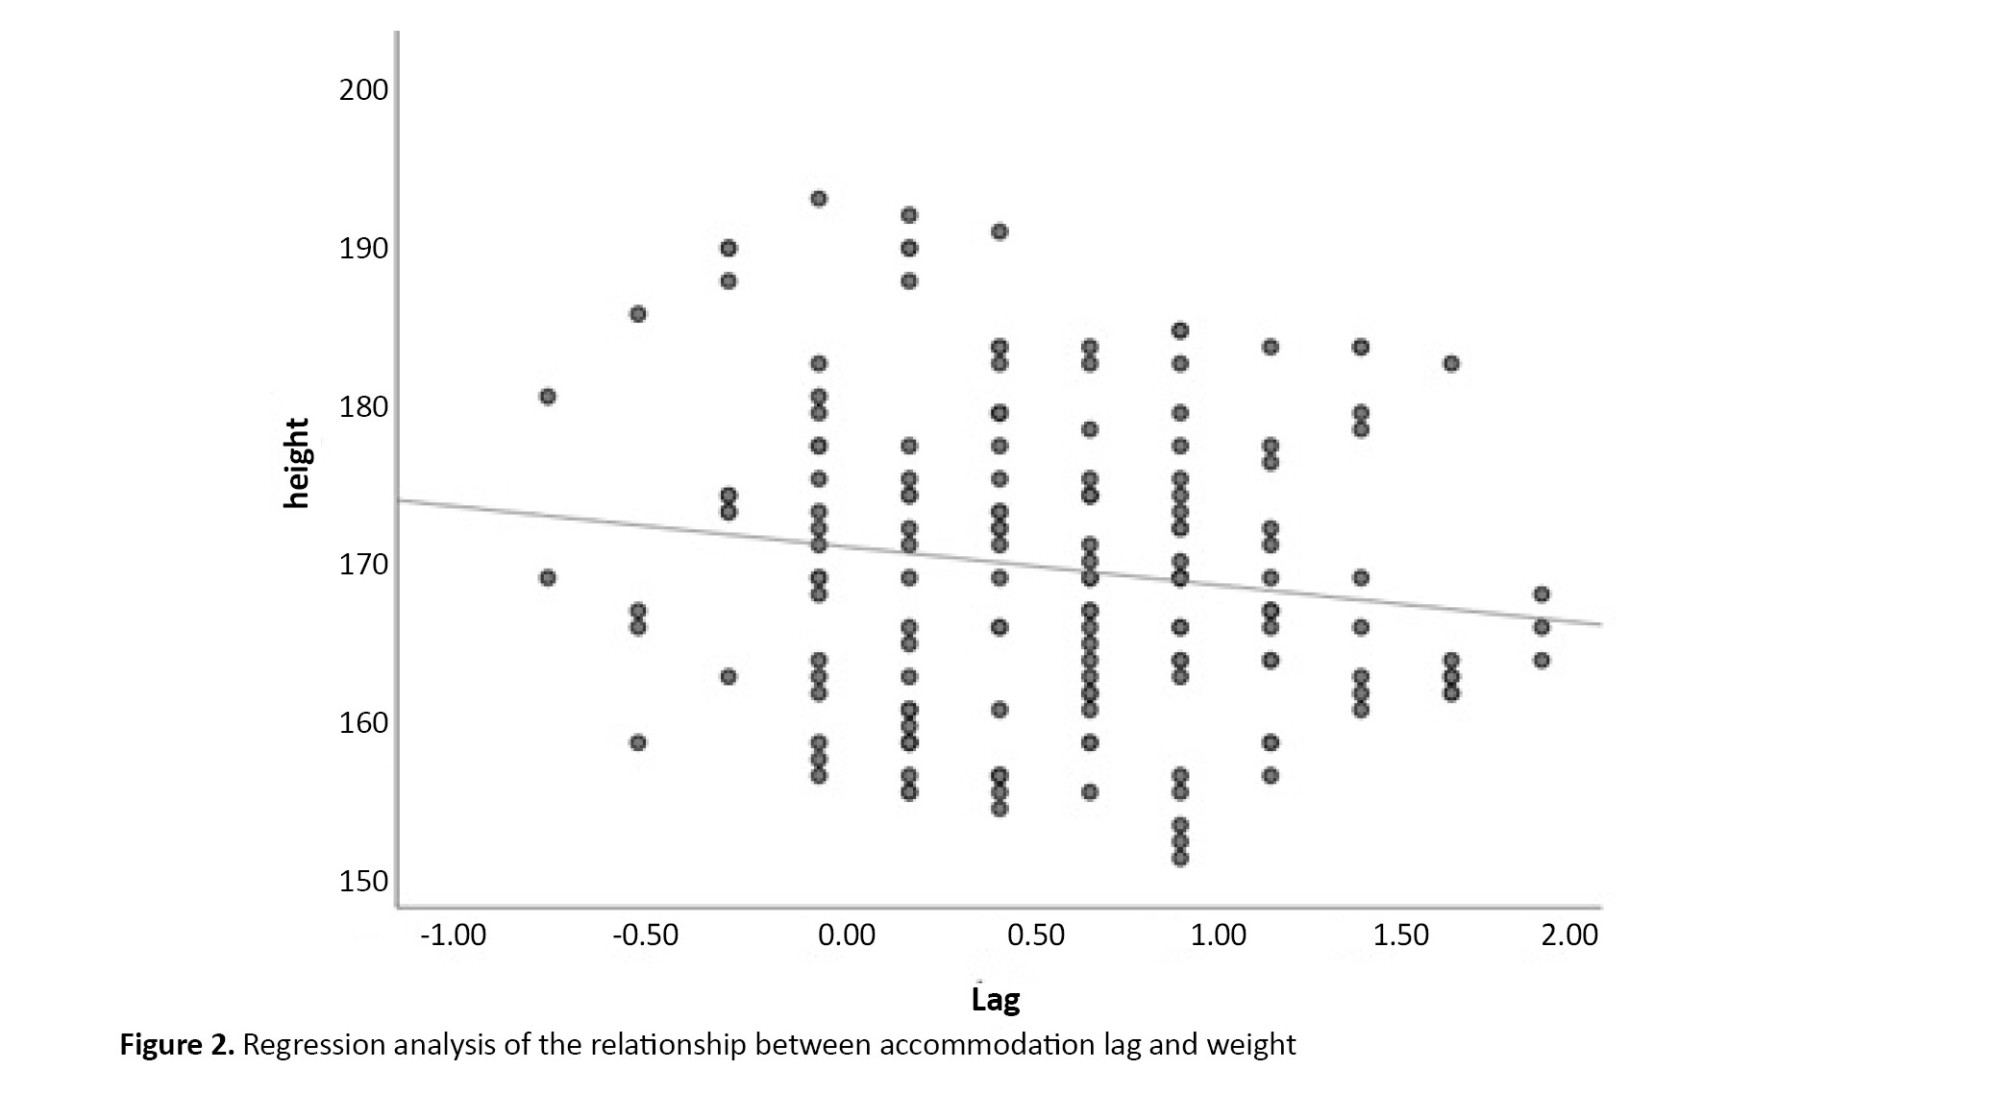
The study found a significant relationship between the lag of accommodation and weight, as shown in Figure 2. The linear regression analysis revealed (R2=0.038, P=0.012). Formula 2 is as follows:
2. Lag=1.16-(0.008)×weight
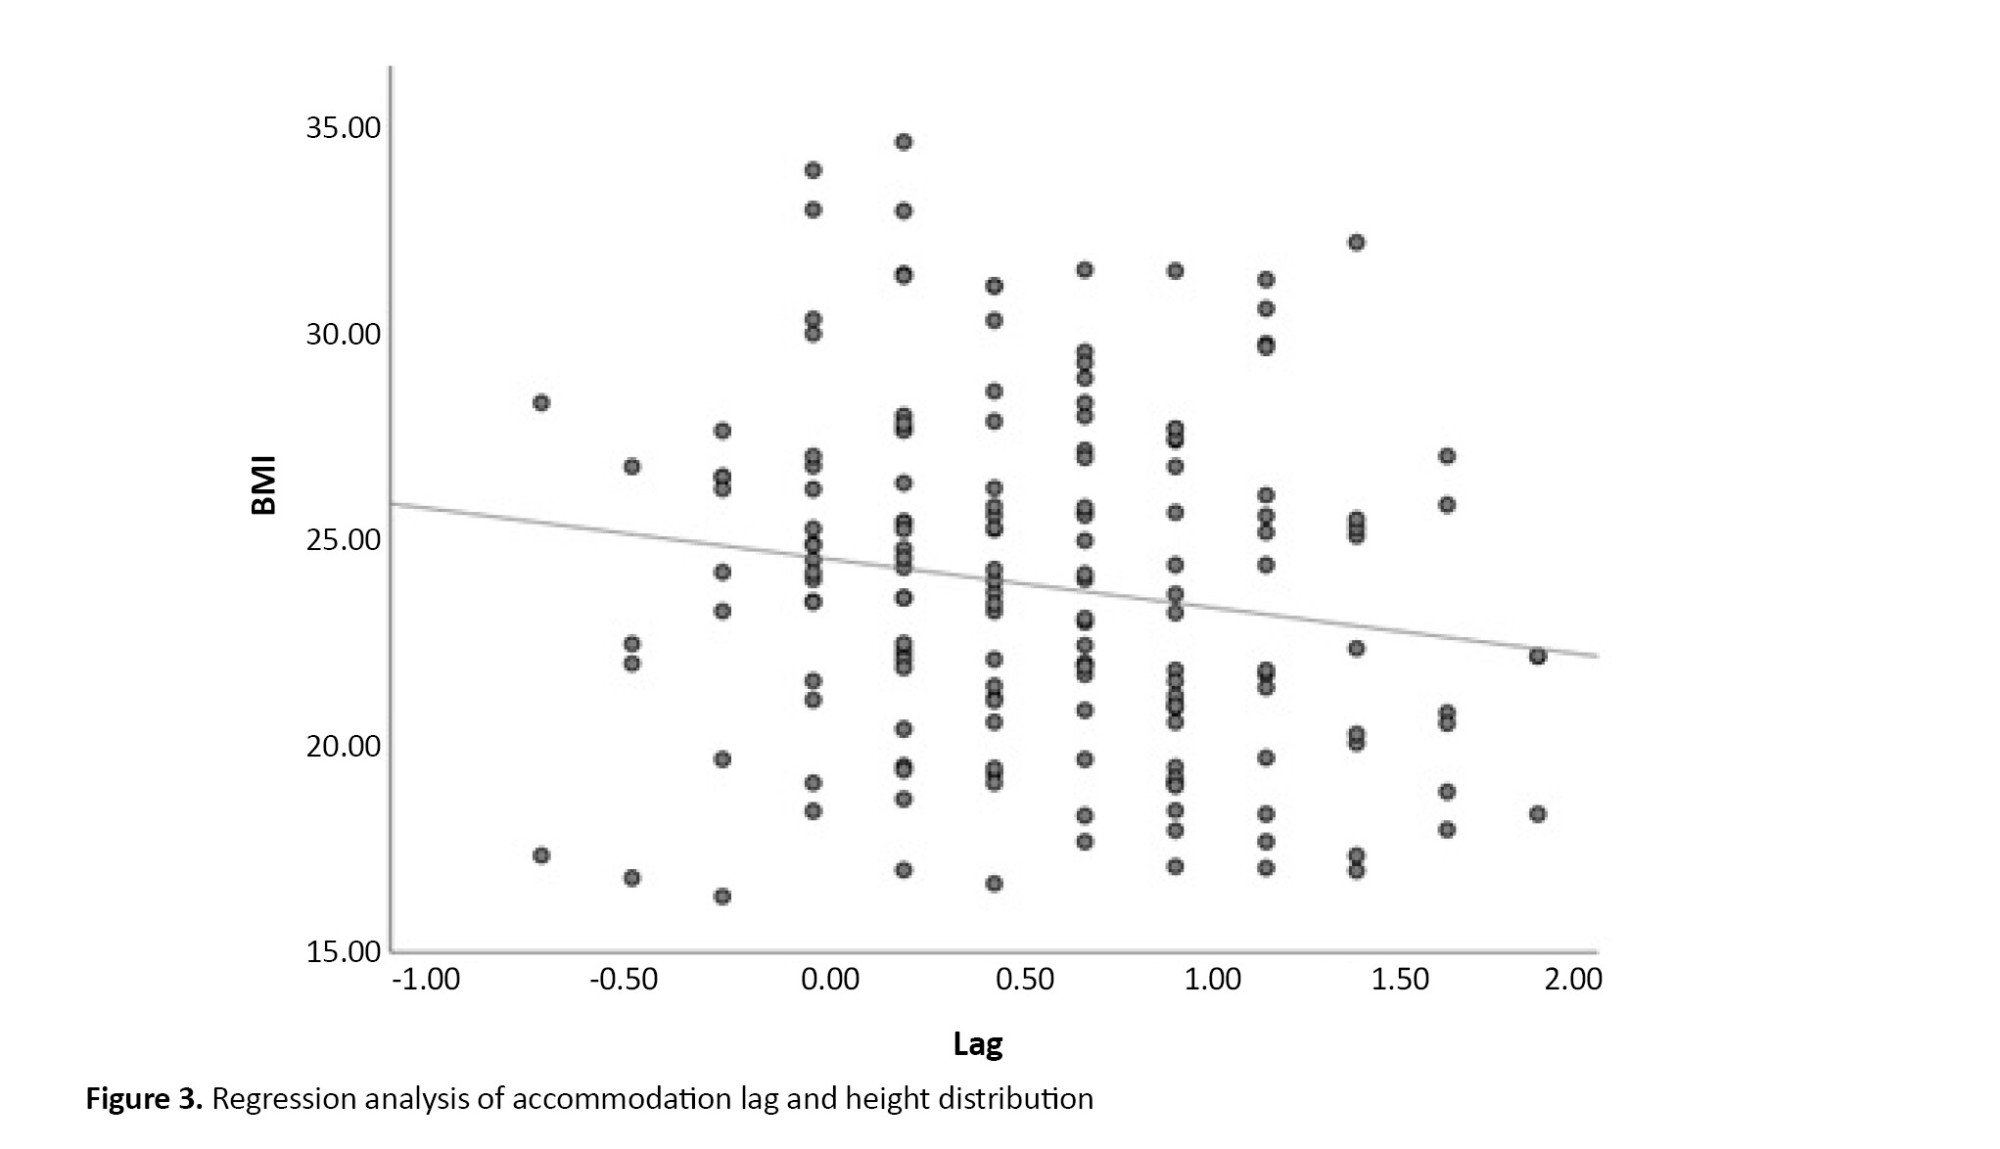
A similar analysis for the lag of accommodation and height showed a significant correlation (P=0.063), as shown in Figure 3.
Discussion
In response to whether BMI is associated with accommodation, the answer is yes. The results indicated a relationship between BMI and accommodation.
However, contrary to most cases where obesity is related to a decline in performance, in the current instance, the decline in accommodation is more closely associated with thinness rather than obesity.
According to the results shown in Table 2, a statistically significant correlation was identified between the lag of accommodation and the reduction in body weight. Nevertheless, a statistically significant correlation was not observed between BMI and either the amplitude of accommodation or facility of accommodation.
The study conducted by Momeni revealed a significant inverse relationship between thinness and convergence ability, suggesting a decline in convergence performance among the underweight group.
Iyamu et al. found a negative correlation between BMI and amplitude of accommodation [11]. Contrary to Iyamu’s study, our results did not reveal a statistically significant relationship between amplitude and BMI (P=0.43). The dissimilarity between these two studies may be attributed to the difference in the ethnic composition of the samples under examination. The research accomplished by Iyamu studied a population of black African individuals living in Nigeria, while our study examined a group of white Iranian participants. Moreover, both studies used linear regression and Dunder’s push-up method as measurement techniques for amplitude. However, it is essential to acknowledge that including participants over a broad age range in Iyamu’s research (ranging from 17 to 70 years) posed a potential bias in accommodation performance, particularly in the older age groups. In addition, BMI and body fat percentage tend to increase with age. This can be mainly attributed to less physical activity and changes in metabolism rate [15]. Furthermore, our research included 83 participants aged 17 to 30 years, constituting about 50% of our sample size. Several variables, including visual demands and lifestyle, occupations, mood and habits, age, heterophoria, measurement errors, refraction, autonomic system, and nutrition, can contribute to variations in results, thus affecting accommodative response [16-19].
Elangovan et al. in their study observed decreased accommodating amplitude in people who were either obese or underweight [12]. Additionally, they found no significant correlation between facility and lag of accommodation and BMI. In contrast to the results of our study, this did not demonstrate
According to a substantial relationship in evaluating amplitude and facility of accommodation, we did notice an inverse impact between lag and BMI.
The comparability of the results of these two studies may be compromised due to variations in race, genetics, and age range, as well as differences in research and statistical analysis methods. Analysis using linear regression may reveal a potential statistical relationship. However, the analysis of variance (ANOVA) test assessing BMI categories may not provide statistically significant differences with similar sample data.
Accommodation lag increased with decreasing BMI. It increased with decreasing weight and also with decreasing height. However, the correlation was not statistically significant between height and lag of accommodation; it is worth noting that the significant level of 0.06 is near the limit of statistical significance and should be considered.
While comparing the provided results and observing Figures 1 and 2, it becomes apparent that weight loss reveals a more noticeable and statistically significant correlation with the lag of accommodation. However, it is essential to acknowledge that the impact of height should be noticed; a clear and consistent correlation is observed between reduced weight and various nutritional disorders.
Three explanations exist for observing such a correlation, the consequences of malnutrition, fixation distance, and the influence of lag on lifestyle.
The research accomplished by Lopes revealed a significant reduction in strength and muscular flexibility among persons afflicted with malnutrition and undergoing weight loss [20]. Further work is required to examine the effects of malnutrition on smooth muscles, with particular emphasis on the ciliary muscle.
Furthermore, Hosseini Yazdi revealed that fasting may result in a decrease in accommodation performance, perhaps due to insufficient nutritional intake [21].
Additionally, when height declines, a proportionate reduction is observed in arm’s length, resulting in a corresponding decrease in working distance. Previous research has shown a positive correlation between decreasing fixation distance and increasing accommodative inaccuracy [22]. Consequently, people with a lower height tend to have a reduced working distance and an increased accommodative lag. Individuals with shorter heights may have a reduced working distance, which may experience a larger accommodative lag. This occurrence may also be attributed to the second plausible reason for supporting this outcome.
Moreover, considering the relationship between BMI and sedentary behavior [23], it is plausible that people with a more considerable accommodative lag may engage in less near work, resulting in less sedentary behavior.
However, a statistically significant correlation was observed based on Figure 3 or formula 2 findings; the coefficient of determination (R2) was just 0.024. This research proposes that although a statistically significant relationship is observed, other variables influence accommodative lag, preventing BMI from being regarded as the only determinant. Due to the widespread availability of BMI calculations and the increasing prevalence of myopia, together with the importance of visual demand in near tasks, BMI may be a good indicator of visual demand and lifestyle.
Based on Momeni’s study, it a correlation was observed between a drop in vergence and a decrease in BMI [13]. One of the clinical signs associated with weak and insufficient convergence is a significant accommodation lag. Therefore, our research results may align with Momeni’s research, considering the aforementioned factors. The relationship between accommodation and convergence should be analyzed, focusing on their simultaneous performance about the research on BMI. Table 2 presents no notable correlation between ease of compatibility and BMI.
No significant correlation is observed between facility and BMI (P=0.35). Elangovan’s research also concluded with the same result. Although our research methods and Elangovan’s vary, the consistency of the outcomes suggests that additional factors affecting matching dynamics may be responsible for the lack of a substantial correlation [24-26]. Additional factors that may contribute to this lack of correlation include heterophoria, refraction, the individual’s visual needs, and their emotional state [16, 27-29].
Conclusion
This research was conducted to investigate the correlation between BMI and the adaptive function of the eyes. The survey’s significance has doubled due to the rise in the prevalence of obesity and thinness and the increasing demand for near tasks. No apparent correlation was observed between facility and amplitude. However, thin individuals exhibited lower levels of accommodation lag. It may be more advantageous to include the accommodation examination, especially response accuracy, in the regular check-ups of thin individuals.
Although we could partially control the intervening variables in this study, such as food and exercise, and we evaluated more samples than in previous studies, there were still some limitations. Occupation and education were not controlled as confounding factors. The number of obese and thin people is rather small, and we did not have control over the impact of the autonomous system, which is recommended for consideration in future studies.
Ethical Considerations
Compliance with ethical guidelines
This study was approved by the Ethics Committee of Iran University of Medical Sciences (Code: IR.IUMS.REC.1401.789).
Funding
The paper was extracted from the master thesis of Ashkan Joolaee, Department of Optometry, School of Rehabilitation Sciences, Iran University of Medical Sciences.
Authors' contributions
Conceptualization, Supervision: Ebrahim Jafarzadehpur, AmirAsharlus; Methodology: All authors; Investigation, Writing-review & editing: All authors; Writing-original draft: All authors; Funding acquisition, Resources: All authors.
Conflict of interest
The authors declared no conflict of interest.
Acknowledgments
We are grateful for the cooperation of Department of Optometry of Iran University of Medical Sciences.
References
The body mass index (BMI) is an anthropometric parameter measurement derived from the square root of weight and height. It is defined into four distinct categories, obese, overweight, normal, and underweight; it indicates the body’s condition concerning thinness and obesity.
According to research conducted in Iran between 2015 and 2023, the prevalence rates of obesity and underweight among adults aged 18 years and above were 21.7% and 17%, respectively. These results highlight the crucial importance of both obesity and thinness [1, 2].
Due to its simplicity and accessibility, measuring BMI has emerged as a viable approach to examining physical body composition and evaluating overweight or underweight individuals [3].
Consequently, many investigations have attempted to investigate the correlation between it and the possibility of playing as a risk factor for the well-being of the body and its various organs.
The concept mentioned earlier also applies to the eyes, and recent research has studied its correlation with eye and vision health. Research results have shown a significant relationship between elevated BMI and increased risk of age-related ocular conditions, including macular degeneration and cataracts. Previous studies have shown a significant correlation between BMI and susceptibility to ocular disorders [4, 5]. Moreover, previous research has shown a correlation between the cup-to-disc ratio and BMI. This result indicates that people with a lower body mass index (BMI) have a higher cup-to-disc ratio and an increased susceptibility to visual abnormalities [6, 7].
Accommodation is the ability of the eye to maintain a clear image of the retina at different distances. It is assessed through maximum power, dynamic, and response accuracy measures. A satisfactory performance in these components results in comfortable and clear vision. At the same time, dysfunction in these parameters can manifest as eye fatigue, lack of focus, occasional blurriness in near vision, and headaches [8].
Moreover, due to the substantial correlation shown in recent studies between accommodative performance and myopia progression, increased emphasis is placed on the need to examine accommodation function [9, 10].
Previous studies have shown limited results about the correlation between accommodation and BMI. In one of these investigations, reduced amplitude accommodation was associated with increased BMI [11].
Another study investigated accommodation and concluded that it affects amplitude accommodation in both overweight and underweight individuals but does not have a significant impact on accommodation facility and response accuracy [12].
In the research conducted by Momeni, a reduced level of convergence was observed when the BMI decreased [13]. This discovery is significant due to the strong correlation between convergence and accommodation.
Despite previous studies, no comprehensive research has been conducted in this field. The primary aim of this research is to investigate whether accommodation components vary according to BMI. When addressing this inquiry, a novel perspective arises concerning the interaction between public health and lifestyle in the context of the ocular accommodation system. This understanding can be applied to the prevention and differential diagnosis of visual impairments in both overweight and underweight individuals.
Materials and Methods
The current study is cross-sectional research conducted at the Serita Optometry Clinic, a privately-owned center in Tehran Province, from January 2021 to October 2022. A total of 168 people aged 18 to 30 years who visited this optometric clinic for an optometric examination were included in the research after considering the inclusion and exclusion criteria.
The inclusion criteria included individuals within the age range of 18 to 30 years who demonstrated full cooperation during tests, best corrected visual acuity of 20.25 or higher at a distance of 6 meters and 40 centimeters, no strabismus or a prior history of strabismus surgery, and no record of head injury or eye trauma.
The exclusion criteria included participants who exhibited intermittent or consistent strabismus with refractive errors of hyperopia or myopia that were not greater than six diopters showed abnormalities in the retina, vitreous, crystalline lens, or cornea, unable to cooperate in the testing procedures, neurological or systemic muscular conditions, metabolic disorders, followed to a specific dietary plan, or engaged in regularly physical activity.
Refraction and preliminary exams were performed for both eyes. However, the accommodation evaluation was undertaken only on the right eye.
In the initial steps, weight was measured using a digital scale, and height was assessed using a meter.
Participants were asked about their physical activities and sports.
The Nidek AR 600 autorefractometer was used to assess the patient’s refraction. At least, three shots were done for each patient, and the mean value of these shots was used for further study results [14].
Subsequent subjective examinations were performed, and the refraction was determined by identifying the most plus amount resulting in optimal visual acuity. Furthermore, the red-green test was used to balance the accommodation status.
According to Dunder’s method, the push-up test was utilized to determine the amplitude of accommodation, which is the maximum capacity of accommodation. The patient’s visual acuity was first assessed using a near-chart at a distance of 40 cm. Then, the outcome of the subjective refraction was inserted into the trial frame. The patient was instructed to focus on the two lines above the visual acuity adjusted to the highest level, corresponding to a line indicating visual acuity of 20.30. Moreover, one eye was partially obstructed during the test. The chart was brought closer to the patient until visual blurring was observed. After that, the patient was asked to blink once and reassess the degree of blurriness. Once the blurring was resolved, the chart was moved closer again until blurring reappeared following a blink. A ruler measured the distance between the reported point and the trial frame at the spectacle plane. This distance is called the near-point accommodation. The amplitude of accommodation is equivalent to the reciprocal of the space above, measured in meters [8].
During the accommodation evaluation process, the patient’s subjective refraction was placed on a trial frame. A monocular test examined accommodation differentially while one eye was occluded. The patient’s near visual acuity was assessed at a distance of 40 cm using a near chart. The patient was instructed to focus on two lines above the visual acuity line that typically represents 20.30, assuming optimal near vision.
To start the test, a lens with a refractive power of +2.00 diopters was placed in front of the trial frame. The patient was instructed to indicate when the induced blur disappeared, and the visual acuity improved to the point where the 20.30 line on the eye chart became clear. Next, a lens with a refractive power of -2.00 diopters was placed in front of the trial frame, and the patient was instructed to indicate when the visual blur disappeared and clarity was restored. This iterative procedure was repeated for one minute to quantify the patient’s ability to complete cycles within one minute, regarded as the measure of accommodation facility, expressed as cycles per minute. The evaluation began using a +2.00 lens to establish an initial state of relaxation [8].
To assess and analyze the accuracy of accommodative responses, the monocular estimated method test, also known as the monocular estimation method, was used. The retinal reflex was examined using the Heine Beta 200 retinoscope. The subjective refraction of the patient was recorded in the trial frame. The patient’s visual acuity was assessed at a closer distance using a near chart positioned at a distance of 40 cm, corresponding to the patient’s usual working distance.
In statistical analysis, descriptive statistics were utilized to categorize the data. These included measures of central tendency, such as the mean, and measures of dispersion, including the standard deviation, maximum, and minimum. Analytical statistics were employed to compare the data, analyze correlation coefficients, and perform linear regression.
The SPSS software, version 26, released in 2019, was used in this research. The researchers used linear regression analysis to investigate the relationship between the accommodation characteristics and each participant’s BMI, height, and weight. Furthermore, the Pearson correlation analysis assessed the relationship between the two eyes. A significance level of <0.05 indicated a statistically significant relationship.
Results
In this study, 168 samples were examined, with 69 male individuals (41.1%) and 99 female individuals (58.9%). Table 1 presents the mean values of independent variables, such as height, weight, BMI, and age. The results showed a statistically significant correlation between the refractions of the left and right eyes (r=0.94, P<0.0001).
Table 2 presents the correlation between height, weight, BMI, and accommodation. The lag of accommodation has a significant correlation with height, weight, and BMI, but facility and amplitude show no significant correlation.
The study found a significant correlation between lag of accommodation and BMI through linear regression analysis. The results suggested an inverse relationship between BMI and lag of accommodation (R2=0.024, P=0.044). Figure 1 shows this relationship, which shows the distribution and regression line. Formula 1 is as follows:
1. Lag=1.165-0.022×BMI
The study found a significant relationship between the lag of accommodation and weight, as shown in Figure 2. The linear regression analysis revealed (R2=0.038, P=0.012). Formula 2 is as follows:
2. Lag=1.16-(0.008)×weight
A similar analysis for the lag of accommodation and height showed a significant correlation (P=0.063), as shown in Figure 3.
Discussion
In response to whether BMI is associated with accommodation, the answer is yes. The results indicated a relationship between BMI and accommodation.
However, contrary to most cases where obesity is related to a decline in performance, in the current instance, the decline in accommodation is more closely associated with thinness rather than obesity.
According to the results shown in Table 2, a statistically significant correlation was identified between the lag of accommodation and the reduction in body weight. Nevertheless, a statistically significant correlation was not observed between BMI and either the amplitude of accommodation or facility of accommodation.
The study conducted by Momeni revealed a significant inverse relationship between thinness and convergence ability, suggesting a decline in convergence performance among the underweight group.
Iyamu et al. found a negative correlation between BMI and amplitude of accommodation [11]. Contrary to Iyamu’s study, our results did not reveal a statistically significant relationship between amplitude and BMI (P=0.43). The dissimilarity between these two studies may be attributed to the difference in the ethnic composition of the samples under examination. The research accomplished by Iyamu studied a population of black African individuals living in Nigeria, while our study examined a group of white Iranian participants. Moreover, both studies used linear regression and Dunder’s push-up method as measurement techniques for amplitude. However, it is essential to acknowledge that including participants over a broad age range in Iyamu’s research (ranging from 17 to 70 years) posed a potential bias in accommodation performance, particularly in the older age groups. In addition, BMI and body fat percentage tend to increase with age. This can be mainly attributed to less physical activity and changes in metabolism rate [15]. Furthermore, our research included 83 participants aged 17 to 30 years, constituting about 50% of our sample size. Several variables, including visual demands and lifestyle, occupations, mood and habits, age, heterophoria, measurement errors, refraction, autonomic system, and nutrition, can contribute to variations in results, thus affecting accommodative response [16-19].
Elangovan et al. in their study observed decreased accommodating amplitude in people who were either obese or underweight [12]. Additionally, they found no significant correlation between facility and lag of accommodation and BMI. In contrast to the results of our study, this did not demonstrate
According to a substantial relationship in evaluating amplitude and facility of accommodation, we did notice an inverse impact between lag and BMI.
The comparability of the results of these two studies may be compromised due to variations in race, genetics, and age range, as well as differences in research and statistical analysis methods. Analysis using linear regression may reveal a potential statistical relationship. However, the analysis of variance (ANOVA) test assessing BMI categories may not provide statistically significant differences with similar sample data.
Accommodation lag increased with decreasing BMI. It increased with decreasing weight and also with decreasing height. However, the correlation was not statistically significant between height and lag of accommodation; it is worth noting that the significant level of 0.06 is near the limit of statistical significance and should be considered.
While comparing the provided results and observing Figures 1 and 2, it becomes apparent that weight loss reveals a more noticeable and statistically significant correlation with the lag of accommodation. However, it is essential to acknowledge that the impact of height should be noticed; a clear and consistent correlation is observed between reduced weight and various nutritional disorders.
Three explanations exist for observing such a correlation, the consequences of malnutrition, fixation distance, and the influence of lag on lifestyle.
The research accomplished by Lopes revealed a significant reduction in strength and muscular flexibility among persons afflicted with malnutrition and undergoing weight loss [20]. Further work is required to examine the effects of malnutrition on smooth muscles, with particular emphasis on the ciliary muscle.
Furthermore, Hosseini Yazdi revealed that fasting may result in a decrease in accommodation performance, perhaps due to insufficient nutritional intake [21].
Additionally, when height declines, a proportionate reduction is observed in arm’s length, resulting in a corresponding decrease in working distance. Previous research has shown a positive correlation between decreasing fixation distance and increasing accommodative inaccuracy [22]. Consequently, people with a lower height tend to have a reduced working distance and an increased accommodative lag. Individuals with shorter heights may have a reduced working distance, which may experience a larger accommodative lag. This occurrence may also be attributed to the second plausible reason for supporting this outcome.
Moreover, considering the relationship between BMI and sedentary behavior [23], it is plausible that people with a more considerable accommodative lag may engage in less near work, resulting in less sedentary behavior.
However, a statistically significant correlation was observed based on Figure 3 or formula 2 findings; the coefficient of determination (R2) was just 0.024. This research proposes that although a statistically significant relationship is observed, other variables influence accommodative lag, preventing BMI from being regarded as the only determinant. Due to the widespread availability of BMI calculations and the increasing prevalence of myopia, together with the importance of visual demand in near tasks, BMI may be a good indicator of visual demand and lifestyle.
Based on Momeni’s study, it a correlation was observed between a drop in vergence and a decrease in BMI [13]. One of the clinical signs associated with weak and insufficient convergence is a significant accommodation lag. Therefore, our research results may align with Momeni’s research, considering the aforementioned factors. The relationship between accommodation and convergence should be analyzed, focusing on their simultaneous performance about the research on BMI. Table 2 presents no notable correlation between ease of compatibility and BMI.
No significant correlation is observed between facility and BMI (P=0.35). Elangovan’s research also concluded with the same result. Although our research methods and Elangovan’s vary, the consistency of the outcomes suggests that additional factors affecting matching dynamics may be responsible for the lack of a substantial correlation [24-26]. Additional factors that may contribute to this lack of correlation include heterophoria, refraction, the individual’s visual needs, and their emotional state [16, 27-29].
Conclusion
This research was conducted to investigate the correlation between BMI and the adaptive function of the eyes. The survey’s significance has doubled due to the rise in the prevalence of obesity and thinness and the increasing demand for near tasks. No apparent correlation was observed between facility and amplitude. However, thin individuals exhibited lower levels of accommodation lag. It may be more advantageous to include the accommodation examination, especially response accuracy, in the regular check-ups of thin individuals.
Although we could partially control the intervening variables in this study, such as food and exercise, and we evaluated more samples than in previous studies, there were still some limitations. Occupation and education were not controlled as confounding factors. The number of obese and thin people is rather small, and we did not have control over the impact of the autonomous system, which is recommended for consideration in future studies.
Ethical Considerations
Compliance with ethical guidelines
This study was approved by the Ethics Committee of Iran University of Medical Sciences (Code: IR.IUMS.REC.1401.789).
Funding
The paper was extracted from the master thesis of Ashkan Joolaee, Department of Optometry, School of Rehabilitation Sciences, Iran University of Medical Sciences.
Authors' contributions
Conceptualization, Supervision: Ebrahim Jafarzadehpur, AmirAsharlus; Methodology: All authors; Investigation, Writing-review & editing: All authors; Writing-original draft: All authors; Funding acquisition, Resources: All authors.
Conflict of interest
The authors declared no conflict of interest.
Acknowledgments
We are grateful for the cooperation of Department of Optometry of Iran University of Medical Sciences.
References
- Sanjari M, Amirkhosravi L, Hosseini SE, Tavakolinejad Kermani M, Abdollahi F, Maghfoori A, et al. Underweight, overweight, obesity and associated factors among elementary school children: A cross-sectional study in Kerman province, Iran. Obes Med. 2023; 38:100477. [DOI:10.1016/j.obmed.2023.100477]
- Rahmani A, Sayehmiri K, Asadollahi K, Sarokhani D, Islami F, Sarokhani M. Investigation of the prevalence of obesity in Iran: A systematic review and meta-analysis study. Acta Med Iran. 2015; 53(10):596-607. [PMID]
- Nuttall FQ. Body mass index: Obesity, BMI, and health: A critical review. Nutr Today. 2015; 50(3):117-28. [DOI:10.1097/NT.0000000000000092] [PMID] [PMCID]
- Ye J, Lou LX, He JJ, Xu YF. Body mass index and risk of age-related cataract: a meta-analysis of prospective cohort studies. Plos One. 2014; 9(2):e89923. [DOI:10.1371/journal.pone.0089923] [PMID] [PMCID]
- Clemons TE, Milton RC, Klein R, Seddon JM, Ferris FL 3rd; Age-Related Eye Disease Study Research Group. Risk factors for the incidence of advanced age-related macular degeneration in the age-related eye disease study (AREDS) AREDS report no. 19. Ophthalmology. 2005; 112(4):533-9. [DOI:10.1016/j.ophtha.2004.10.047] [PMID] [PMCID]
- Panon N, Luangsawang K, Rugaber C, Tongchit T, Thongsepee N, Cheaha D, et al. Correlation between body mass index and ocular parameters. Clin Ophthalmol. 2019; 13:763-9. [DOI:10.2147/OPTH.S196622] [PMID] [PMCID]
- Yang F, Yang C, Liu Y, Peng S, Liu B, Gao X, et al. Associations between body mass index and visual impairment of school students in central China. Int J Environ Res Public Health. 2016; 13(10):1024. [DOI:10.3390/ijerph13101024] [PMID] [PMCID]
- Scheiman M, Wick B. Clinical management of binocular vision: Heterophoric, accommodative, and eye movement disorders. Philadelphia: Lippincott Williams & Wilkins; 2008. [Link]
- Wijayati MP, Triningrat AAMP, Pemayun CD, Handayani AT, Suryathi NMA, Surasmiati NMA. Correlation near point of convergence and amplitude accommodation with school myopia progression at near activity in badung regency. Open Access Maced J Med Sci. 2022; 10(B):1195-201. [DOI:10.3889/oamjms.2022.9331]
- Schmid KL, Strang NC. Differences in the accommodation stimulus response curves of adult myopes and emmetropes: A summary and update. Ophthalmic Physiol Opt. 2015; 35(6):613-21. [DOI:10.1111/opo.12255] [PMID]
- Iyamu E, Iyamu JE, Oghovwerha L. Anthropometry, amplitude of accommodation, and spherical equivalent refractive error in a nigerian population. ISRN Ophthalmol. 2012; 2012:295613. [DOI:10.5402/2012/295613] [PMID] [PMCID]
- Elangovan N, Shanmugham DBM. Binocular vision parameters and body mass index. Med Hypothesis Discov Innov Optom. 2023; 4(1):17-24. [DOI:10.51329/mehdioptometry169]
- Momeni-Moghaddam H, Kundart J, Ehsani M, Abdeh-Kykha A. Body mass index and binocular vision skills. Saudi J Ophthalmol. 2012; 26(3):331-4. [DOI:10.1016/j.sjopt.2012.01.002] [PMID] [PMCID]
- Benjamin WJ. Borish’s clinical refraction-E-Book. Edinburgh: Elsevier Health Sciences; 2006. [Link]
- Meeuwsen S, Horgan GW, Elia M. The relationship between BMI and percent body fat, measured by bioelectrical impedance, in a large adult sample is curvilinear and influenced by age and sex. Clin Nutr. 2010; 29(5):560-6. [DOI:10.1016/j.clnu.2009.12.011] [PMID]
- De-Hita-Cantalejo C, Benítez-Rodríguez MD, Sánchez-González MC, Bautista-Llamas MJ, Sánchez-González JM. Accommodation response variations in university students under high demand for near-vision activity. Life. 2022; 12(11):1837. [DOI:10.3390/life12111837] [PMID] [PMCID]
- Latif N, Naroo SA. Transient effects of smoking on the eye. Cont Lens Anterior Eye. 2022; 45(5):101595. [DOI:10.1016/j.clae.2022.101595] [PMID]
- Abokyi S, Owusu-Mensah J, Osei KA. Caffeine intake is associated with pupil dilation and enhanced accommodation. Eye. 2017; 31(4):615-9. [DOI:10.1038/eye.2016.288] [PMID] [PMCID]
- Abraham LM, Kuriakose T, Sivanandam V, Venkatesan N, Thomas R, Muliyil J. Amplitude of accommodation and its relation to refractive errors. Indian J Ophthalmol. 2005; 53(2):105-8. [DOI:10.4103/0301-4738.16173] [PMID]
- Lopes J, Russell DM, Whitwell J, Jeejeebhoy KN. Skeletal muscle function in malnutrition. Am J Clin Nutr. 1982; 36(4):602-10. [DOI:10.1093/ajcn/36.4.602] [PMID]
- Hoseini-Yazdi SH, Jafarzadehpur E, Mirzajani A, Nematy M. Evaluation of ocular accommodation, convergence and fusional vergence changes during Ramadan. J Nutr Fasting Health. 2013; 1(1):13-8. [DOI:10.22038/jfh.2013.301]
- Masters B. William J. Benjamin, Editor, Irvin M. Borish, Consultant; Borish’s Clinical Refraction, second edition. Graefes Arch Clin Exp Ophthalmol. 2009; 247:429–31. [Link]
- Mitchell JA, Mattocks C, Ness AR, Leary SD, Pate RR, Dowda M, et al. Sedentary behavior and obesity in a large cohort of children. Obesity. 2009; 17(8):1596-602. [DOI:10.1038/oby.2009.42] [PMID] [PMCID]
- Otero C, Aldaba M, López S, Díaz-Doutón F, Vera-Díaz FA, Pujol J. Random changes of accommodation stimuli: An automated extension of the flippers accommodative facility test. Curr Eye Res. 2018; 43(6):788-95. [DOI:10.1080/02713683.2018.1444181] [PMID]
- Iwasaki T. Effects of a visual task with cognitive demand on dynamic and steady-state accommodation. Ophthalmic Physiol Opt. 1993; 13(3):285-90. [DOI:10.1111/j.1475-1313.1993.tb00470.x] [PMID]
- Padavettan C, Nishanth S, Vidhyalakshmi S, Madhivanan N, Madhivanan N. Changes in vergence and accommodation parameters after smartphone use in healthy adults. Indian J Ophthalmol. 2021; 69(6):1487-90. [DOI:10.4103/ijo.IJO_2956_20] [PMID] [PMCID]
- Goss DA, Rainey BB. Relationship of accommodative response and nearpoint phoria in a sample of myopic children. Optom Vis Sci. 1999; 76(5):292-4. [DOI:10.1097/00006324-199905000-00016] [PMID]
- Ramamurthy D, Radhakrishnan H, Pardhan S. Associations between accommodative facility, age, and refractive errors in early, older adolescent myopes and emmetropes. Br Ir Orthopt J. 2023; 19(1):15-25. [DOI:10.22599/bioj.284] [PMID] [PMCID]
- Pandian A, Sankaridurg PR, Naduvilath T, O'Leary D, Sweeney DF, Rose K, et al. Accommodative facility in eyes with and without myopia. Invest Ophthalmol Vis Sci. 2006; 47(11):4725-31. [DOI:10.1167/iovs.05-1078] [PMID]
Type of Study: Research |
Subject:
Optometry
Received: 2024/01/9 | Accepted: 2024/02/7 | Published: 2023/02/7
Received: 2024/01/9 | Accepted: 2024/02/7 | Published: 2023/02/7
Contact Information

All the work in this journal are licensed under a Creative Commons
ATTRIBUTION-NONCOMMERCIAL-SHAREALIKE 4.0
INTERNATIONAL International License.
Tehran Province, Tehran, District 3, Mirdamad Ave, Nezam Ave, School of Rehabilitation Science
Tel: +98 21 22228051-2 Ext: 180
Fax98 21 22220946
All the work in this journal are licensed under a Creative Commons
ATTRIBUTION-NONCOMMERCIAL-SHAREALIKE 4.0
INTERNATIONAL International License.