Volume 5, Issue 1 (Continuously Updated 2022)
Func Disabil J 2022, 5(1): 0-0 |
Back to browse issues page
Download citation:
BibTeX | RIS | EndNote | Medlars | ProCite | Reference Manager | RefWorks
Send citation to:


BibTeX | RIS | EndNote | Medlars | ProCite | Reference Manager | RefWorks
Send citation to:
Jalilevand N, Mohamadi R, Ghorbani A, Kamali M, Hassanpour N, Heydarpanahi S, et al . Psychometric Evaluation of the Receptive Picture Vocabulary Test for Persian-speaking Children. Func Disabil J 2022; 5 (1) : 73
URL: http://fdj.iums.ac.ir/article-1-212-en.html
URL: http://fdj.iums.ac.ir/article-1-212-en.html
Nahid Jalilevand1 

 , Reyhane Mohamadi1

 , Ali Ghorbani1

 , Mohammad Kamali *2

 , Nafise Hassanpour3

 , Saba Heydarpanahi1

 , Tahmine Maleki3

 , Fatemeh Ashrafi1


 , Reyhane Mohamadi1

 , Ali Ghorbani1

 , Mohammad Kamali *2

 , Nafise Hassanpour3

 , Saba Heydarpanahi1

 , Tahmine Maleki3

 , Fatemeh Ashrafi1


1- Department of Speech Therapy, School of Rehabilitation Sciences, Iran University of Medical Sciences, Tehran, Iran.
2- Rehabilitation Research Center, Iran University of Medical Sciences, Tehran, Iran. ,kamali.mo@iums.ac.ir
3- Rehabilitation Research Center, Iran University of Medical Sciences, Tehran, Iran.
2- Rehabilitation Research Center, Iran University of Medical Sciences, Tehran, Iran. ,
3- Rehabilitation Research Center, Iran University of Medical Sciences, Tehran, Iran.
Full-Text [PDF 1379 kb]
(440 Downloads)
| Abstract (HTML) (1205 Views)
Full-Text: (625 Views)
Introduction
Word comprehension is one of the essential skills for language development and communication. All words that a person can understand mean receptive vocabulary. In the first months of life, normal toddlers begin to understand words before they start to use words for speaking. By the age of 12 months, toddlers recognize about 20 words but rapidly expand their receptive vocabulary to about 1000 words by age three [1]. Children with language disorders or developmental language disorders have communication problems in early childhood [2], therefore, they should be referred to a speech and language pathologist (SLP). One of the assessment tools is a receptive vocabulary test to determine the children’s word comprehension skills. The SLP assess children to determine their abilities to understand words and whether they need clinical practice to improve word comprehension skills [3]. The clinicians can use a norm-referenced test and compare the client’s scores with the characteristics of normative data [4]. One of the norm-referenced tests for receptive vocabulary assessment is the Peabody picture vocabulary test (PPVT) the 4th edition (PPVT-4), which can be used to evaluate English-speaking adults and children. It consists of 228 items, which are divided into 19 item sets [5]. Many authors who used PPVT in their research concluded that bilingual children’s scores were lower than monolingual peers [6]. Some researchers reported adaptation and psychometric properties of the PPVT in their language, for example, Greek, African, Brazilian Portuguese, and Mexican languages [7-10].
So far, no prior study has been conducted on the Persian version of the PPVT. However, Hasanpour et al developed the first version of RPVT-P for children aged 30-71 months and reported its validity and reliability. The RPV included 240 color pictures (items) divided into 15 subtests, each subtest consisted of 16 pictures. The vocabulary subtests include tools, objects, body parts, verbs, clothes, edibles, animals, means of transportation, adjectives, occupations, animals, body parts, places, plant components, colors, and nature. The first version of RPVT-P was a paper-based; the pictures of vocabulary in the paper were shown to the children by the examiner. Hassanpour et al. reported psychometric properties of the RPVT-P. The study participants included 91 normal children in 7 age groups with an age group of 6 months. A value of 0.909 was reported for Cronbach’s α, indicating good internal consistency. The seven–day test-retest reliability using intra-class correlation (ICC) was estimated at 0.81 considered good reliability. The results of the analysis of variance (ANOVA) test showed a significant difference between the age groups in the mean total score of the RPVT-P (P=0.000). No significant differences were reported between gender and the total scores of the RPVT-P (P>0.05) [11].
Hydarpanahi et al [12] developed the second version of the RPVT-P. The second version of RPVT-P was computer-based, therefore the examiner showed the pictures of vocabulary on a computer to the children. The experts approved the quality of the pictures of the second version of the RPVT-P. The mean content validity ratio and content validity index were 0.91 and 0.93, respectively. In their study, 1.5 typically developing Persian-speaking children aged 30-71 months participated. A statistically significant difference was reported between age groups in the mean total scores of the RPVT-P (P<0.05). A value of 0.95 for Cronbach’s α was reported as a good internal consistency. The value of the ICC for the receptive picture vocabulary test was 0.89. The results demonstrated that the RPVT-P has sufficient psychometric properties. They concluded that the RPVT-P is a suitable tool to assess the receptive vocabulary of children aged 30-71 months [12].
According to most statisticians, the minimum sample size is 100 people [13]. It is recommended that the sample size should not be less than 250 [14]. The current study aims to determine the psychometric properties of the RPVT-P using a convenience sampling method. According to the law of the sample-to-variable ratio, 15 to 20 samples per variable were considered, [15]. Hence, as the number of the RPVT-P subtests (variables) is 15, the maximum acceptable sample size is 300 people. The researchers suggested 300 people as a good sample size for data analysis.
The current study was conducted to evaluate internal consistency (Cronbach’s α coefficient), construct validity, and discriminant validity of the RPVT-P and to compute Z- scores for raw scores (total scores) of the RPVT-P.
Materials and Methods
The current study was designed in 2 stages:
Stage1
Participants
The sample included 434 typically developed Persian-speaking children aged 30-71 months from kindergartens in 3 Iranian cities, Tehran, Rey, and Isfahan.
The inclusion criteria included age between 30 and 71 months, good general health based on age and stage questionnaire [16], Persian language, good verbal communication ability, no history of seizure, motor or visual impairment, cerebral palsy, genetic syndromes based on medical records and SLP informal assessment.
Materials
The second version of the RPVT-P is a computer-based test, including 240 color pictures divided into 15 subtests and each subtest consisted of 16 pictures. The name of each subtest is as followed:
Tools, home appliances, body organs, verbs, clothes, animals, fruits and foods, vehicles, related to animals, adjectives and opposites, jobs, places, plant words, nature words, and colors.
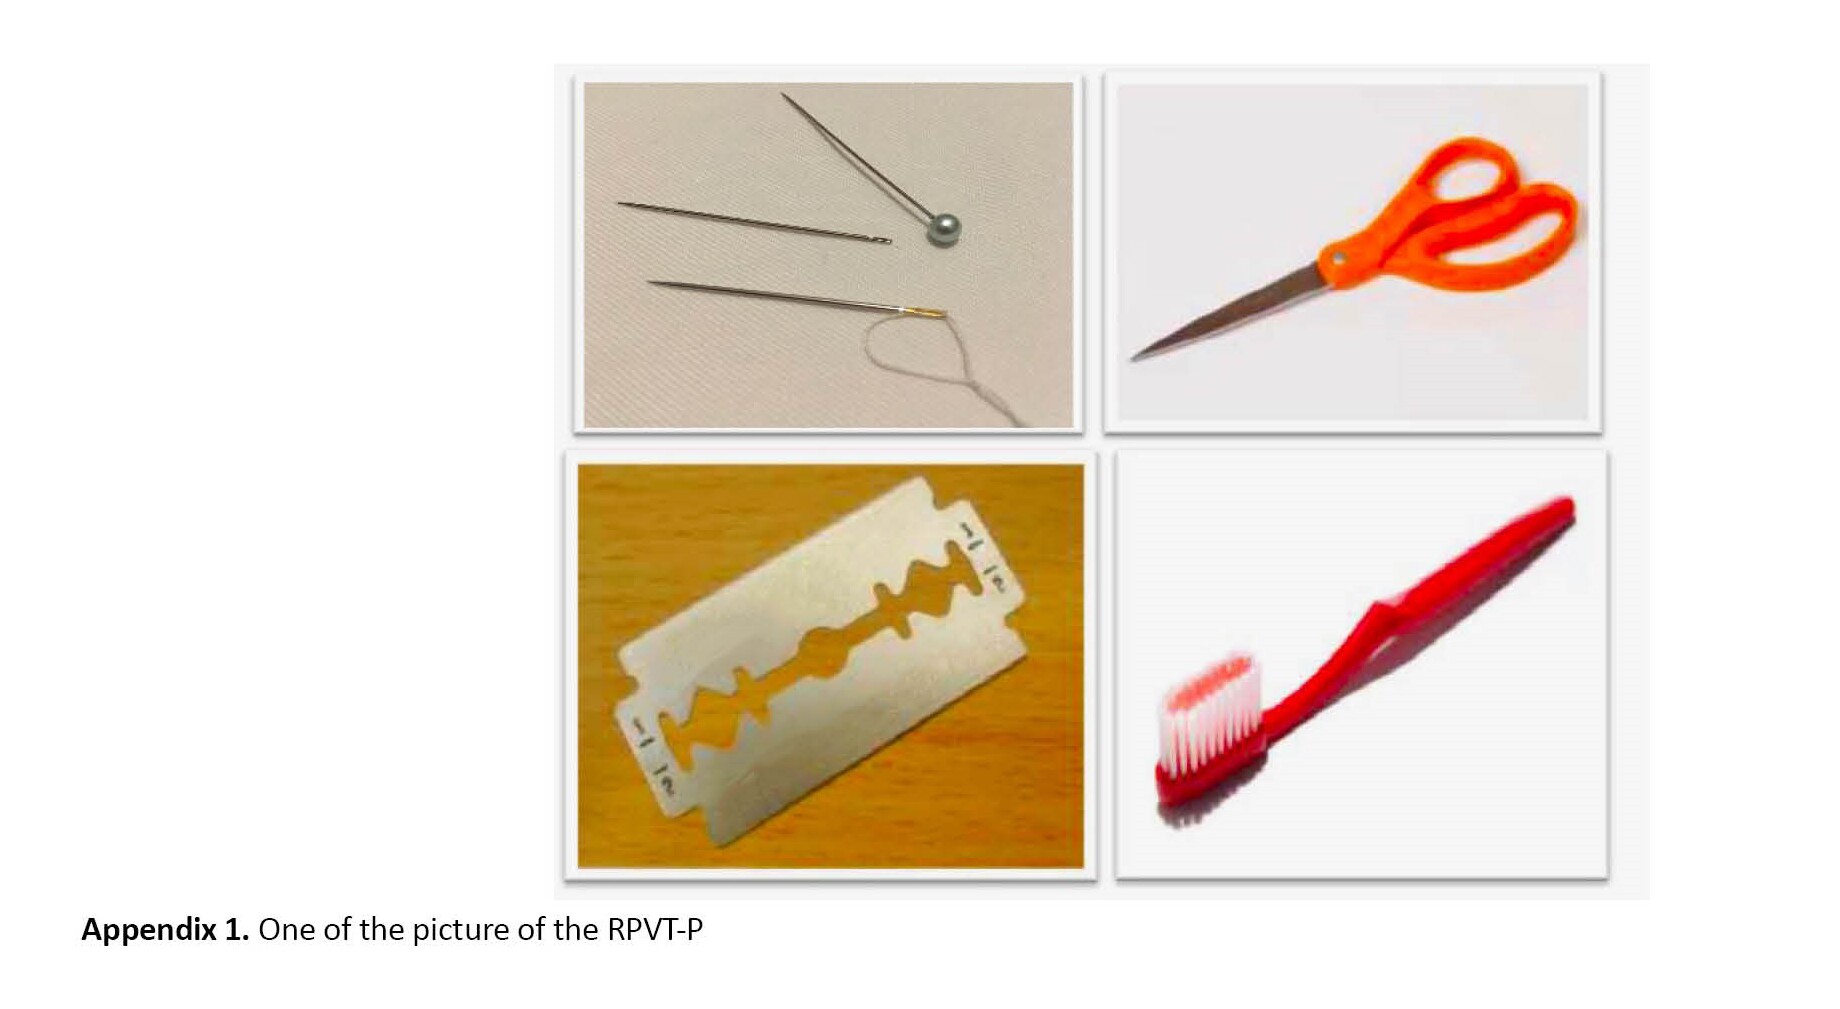
The pictures of the RPVT-P were displayed from labtop screen to each participant by the examiner (Appendix 1 shows one of the pictures of the RPVT-P). In a quiet room, the examiner encouraged the child to show one picture of 4 pictures on a page that he was listening to. If the child pointed with her/his finger correctly, the examiner marked (√) on the test form. The examiner calculated all the correct answers as the total score for each subtest and the total score for all items.
Statistical analysis
The data were analyzed descriptively and inferentially using the skewness and kurtosis values to assess the normality of the data distribution. For a sample size >300, the normality of the data depends on the absolute values of skewness and kurtosis. The skewness value ≤2 and kurtosis value ≤4 were used as reference values to determine data normality [17]. The normal distribution of data was confirmed and parametric statistical tests were used. The statistical significance level was P<0.05.
The internal consistency of the RPVT-P was evaluated by Cronbach’s α coefficient and Cronbach’s α in case of item deletion. The correlation between the items was measured using the Pearson correlation coefficient.
The t-test was used for the difference between the sexes, and Pearson’s correlation coefficient was used to verify the correlation between the variables of age and the total scores RPVT-P. To obtain standard scores, the raw score (total score) of the subjects was converted to the Z score. In this study, the raw score with a mean of 100 and a standard deviation of 15 was converted into a standard score.
A confidence interval of 95% and a significance level of 0.05 were considered. The SPSS software, version 21 was used to analyze.
Stage 2
Stage 2 aimed to evaluate the discriminant validity of the RPVT-P.
Participants
The participants in the second stage of this study included 32 children in 2 groups, group 1: 16 Down syndrome (DS) children aged between 7.3 and 14.4 years compared to 16 normal children in group 2 aged 4-5.9 years, who were matched in terms of general intelligence. The normal developing children have no history of hearing problems, neurological disorders, or speech and language problems. They attended kindergartens in Tehran. The participants with DS were recruited from the Down Syndrome Association in Tehran City, Iran.
The Stanford–Binet intelligence scale test was used to calculate the mental age of children. The children with DS and typically developing (TD) peers were matched for non-verbal mental age based on the Stanford–Binet intelligence scale test.
Statistical analysis
The data were analyzed descriptively and inferentially using the Kolmogorov-Smirnov test to assess the normality of the data distribution. The normal distribution of data was confirmed and parametric statistical tests were used. The statistical significance level was P<0.05. T-test for the difference between the 2 groups in the means total scores of RPVT-P. A confidence interval of 95% and a significance level of 0.05 were considered. The SPSS software, version 21 was used to analyze.
Results
Stage 1
In the first stage of the current study, 227 boys (52.3 %) and 207 girls (47.7%) aged 30-71 months participated. Table 1 presents the descriptive statistics of the age and gender of participants in 6-month intervals.

Table 2 presents the descriptive statistics of the total scores of the RPVT-P for each age group.

Table 3 presents the Mean±SD of the total scores of each item of the RPVT-P for each group. Internal consistency of the RPVT-P was revealed with a Cronbach’s α coefficient of 0.825.
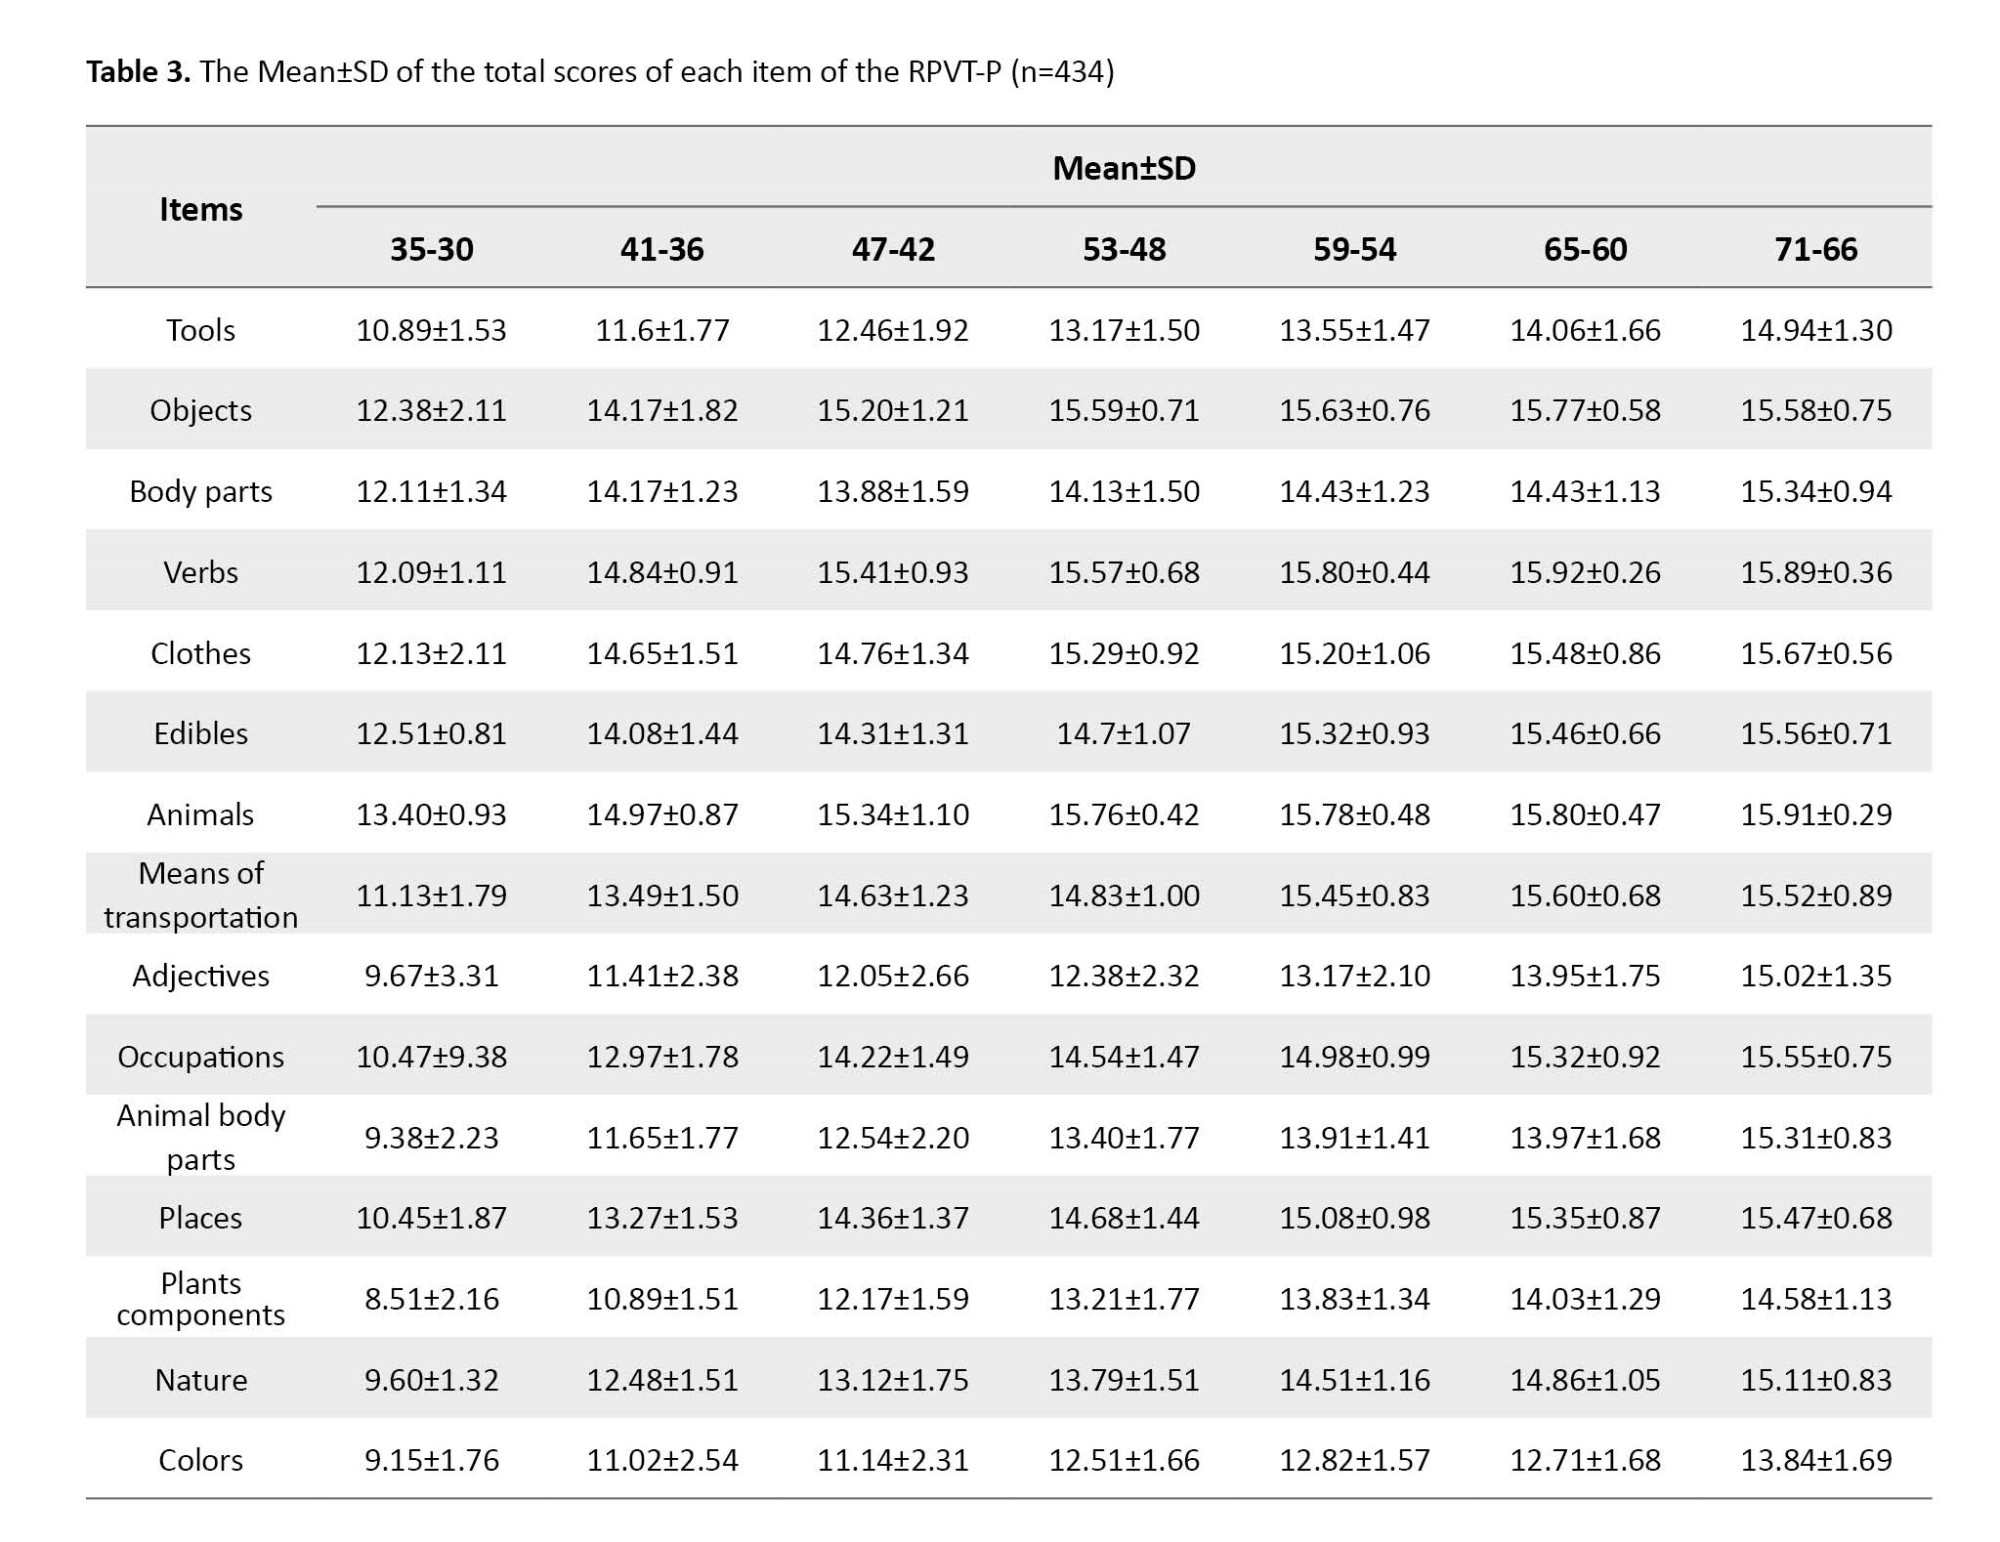
Cronbach’s α did not exceed the total coefficients after removing each item (Table 4).
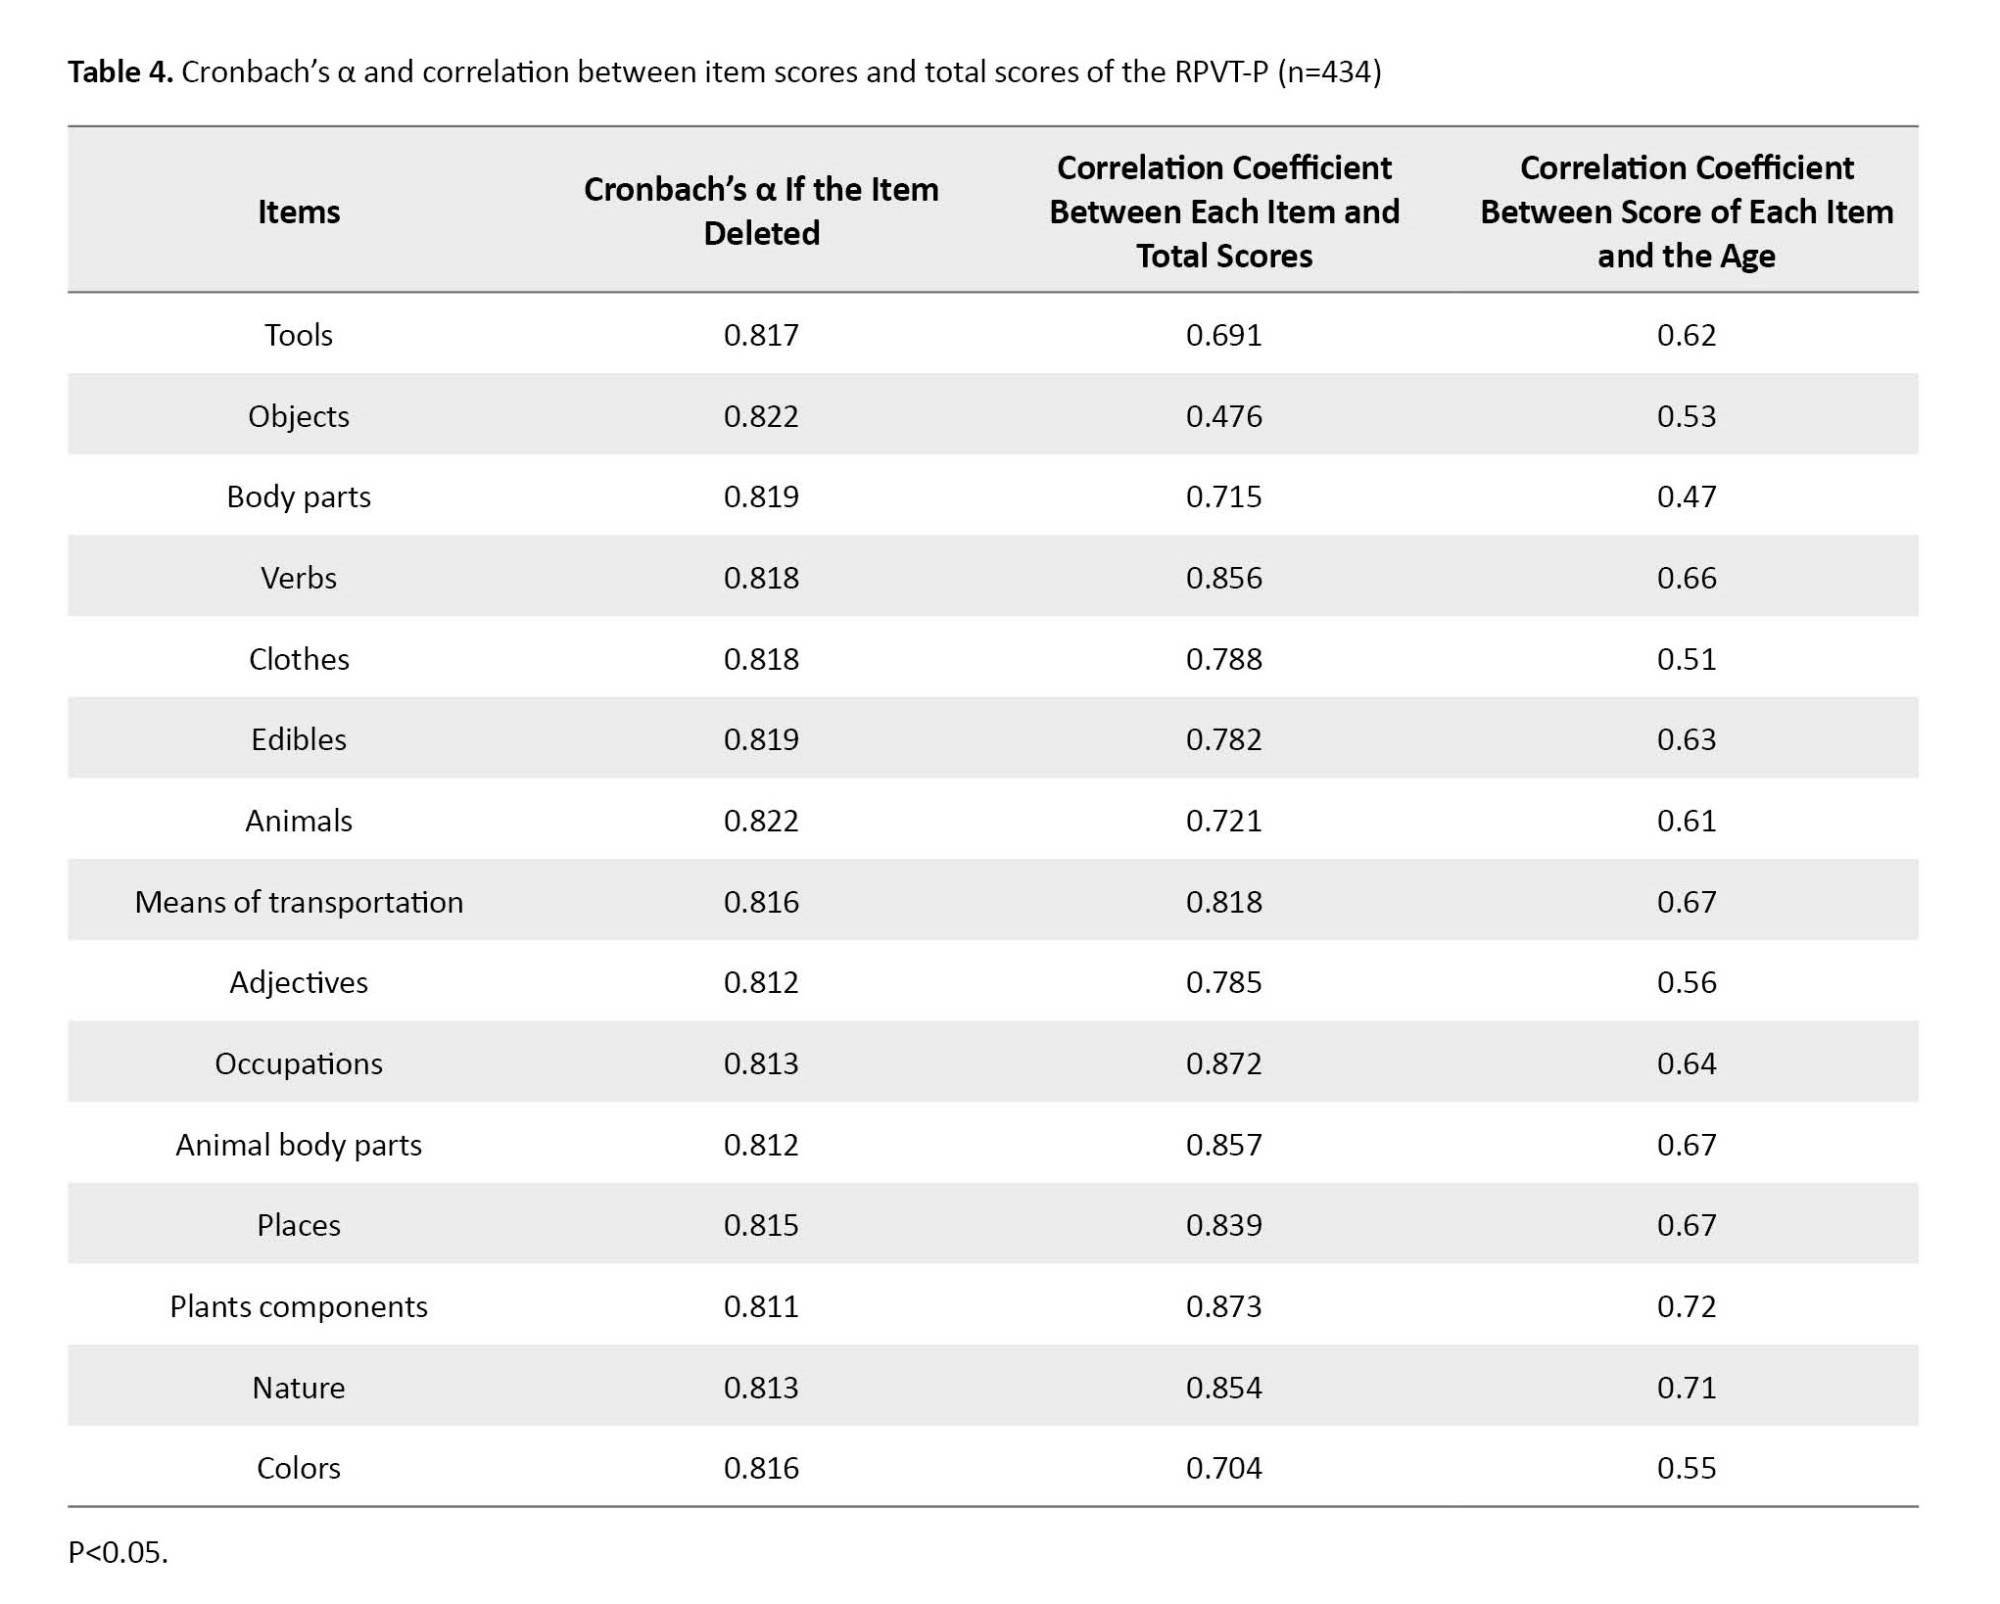
A significant item-total correlation coefficient was observed (P=0.0001). The Pearson’s correlation coefficient between the total score of the RPVT-P and age was 0.795 (P=0.0001). Table 4 presents a significant correlation coefficient between the score of each item of the RPVT-P and age (P=0.0001). The results showed that the correlation coefficient between the score of each item of the RPVT was statistically significant (P=0.001) ( Table 5).
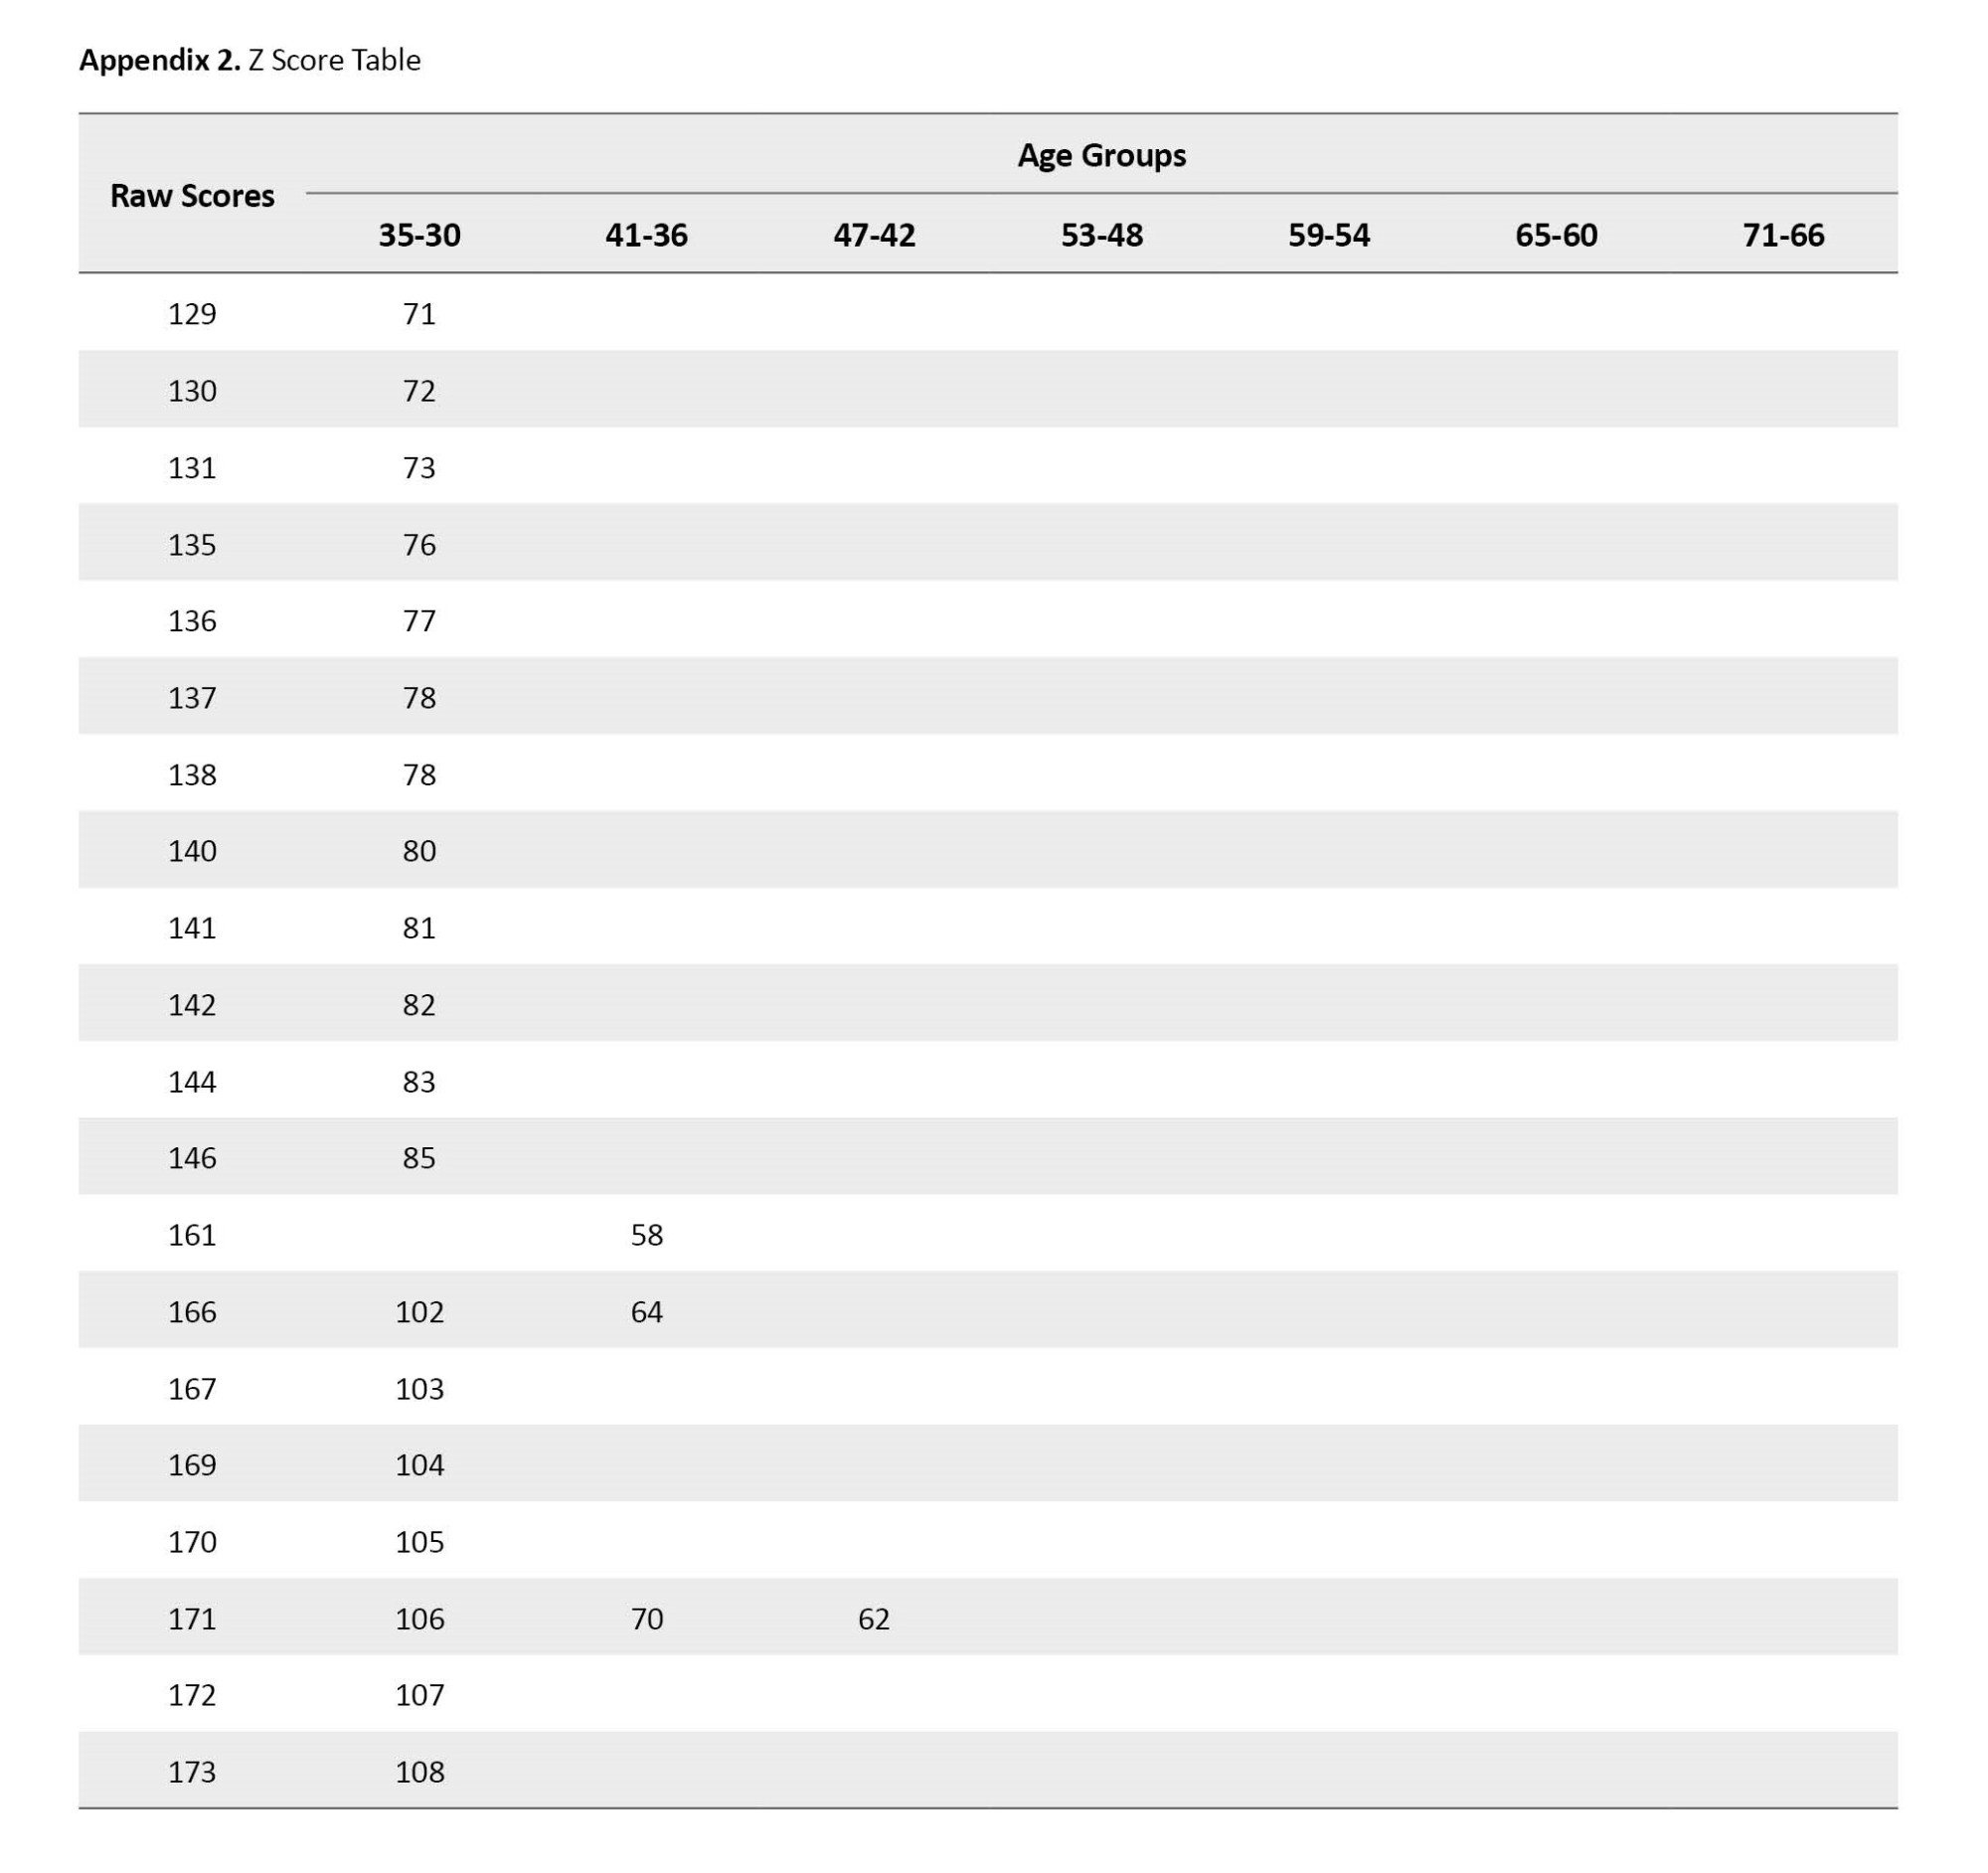
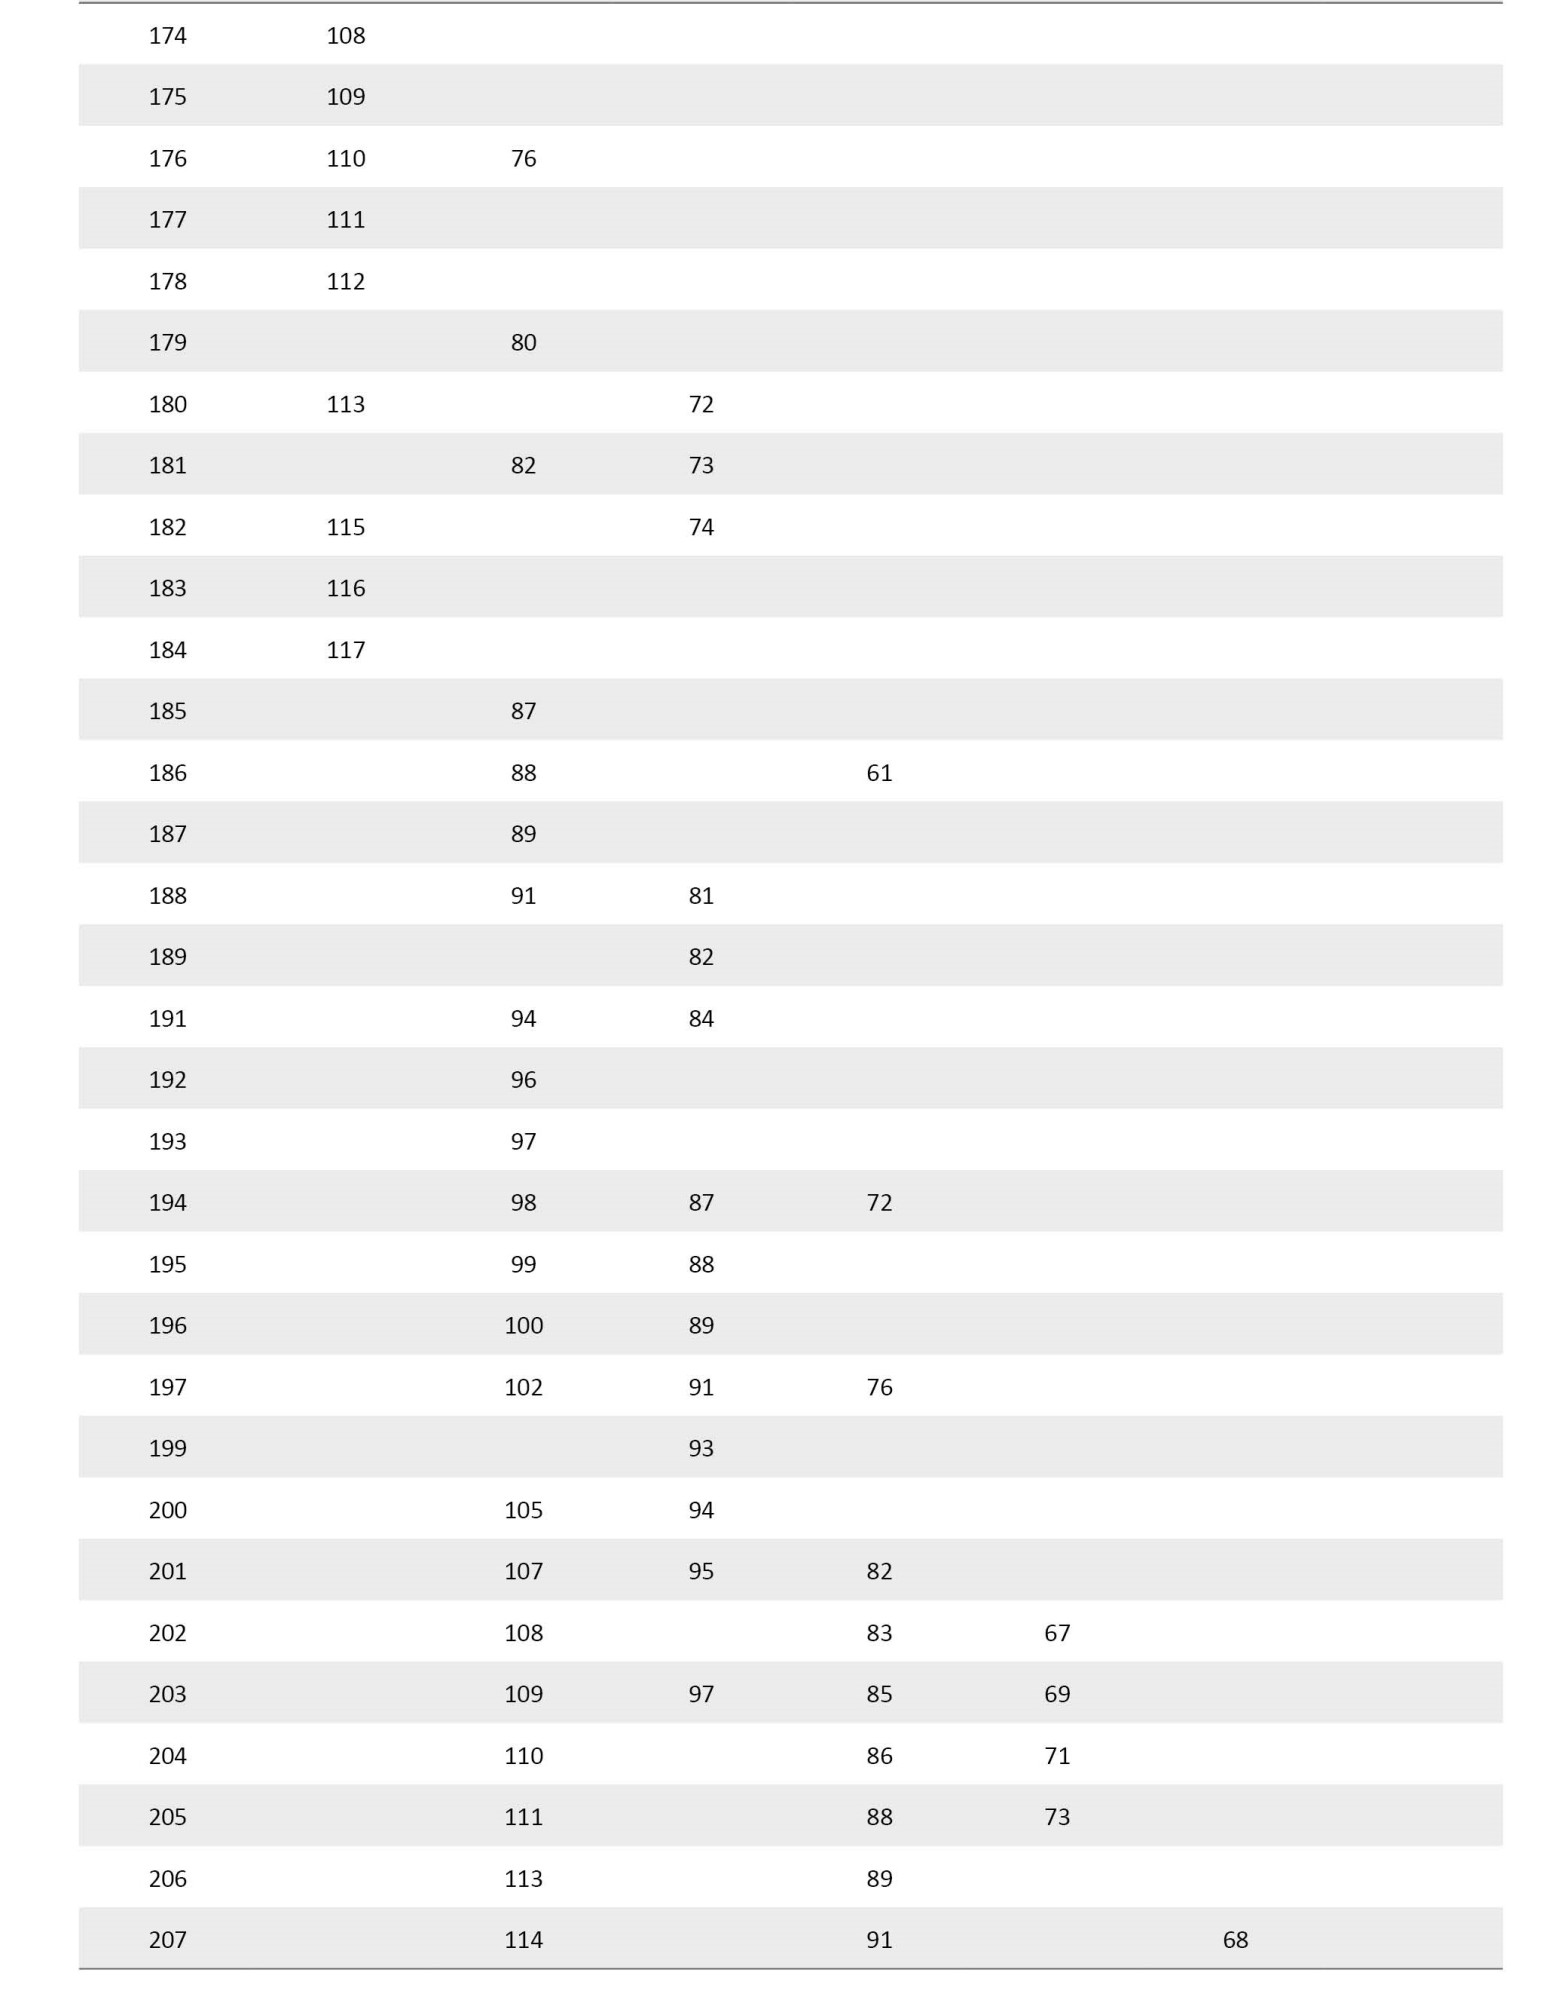
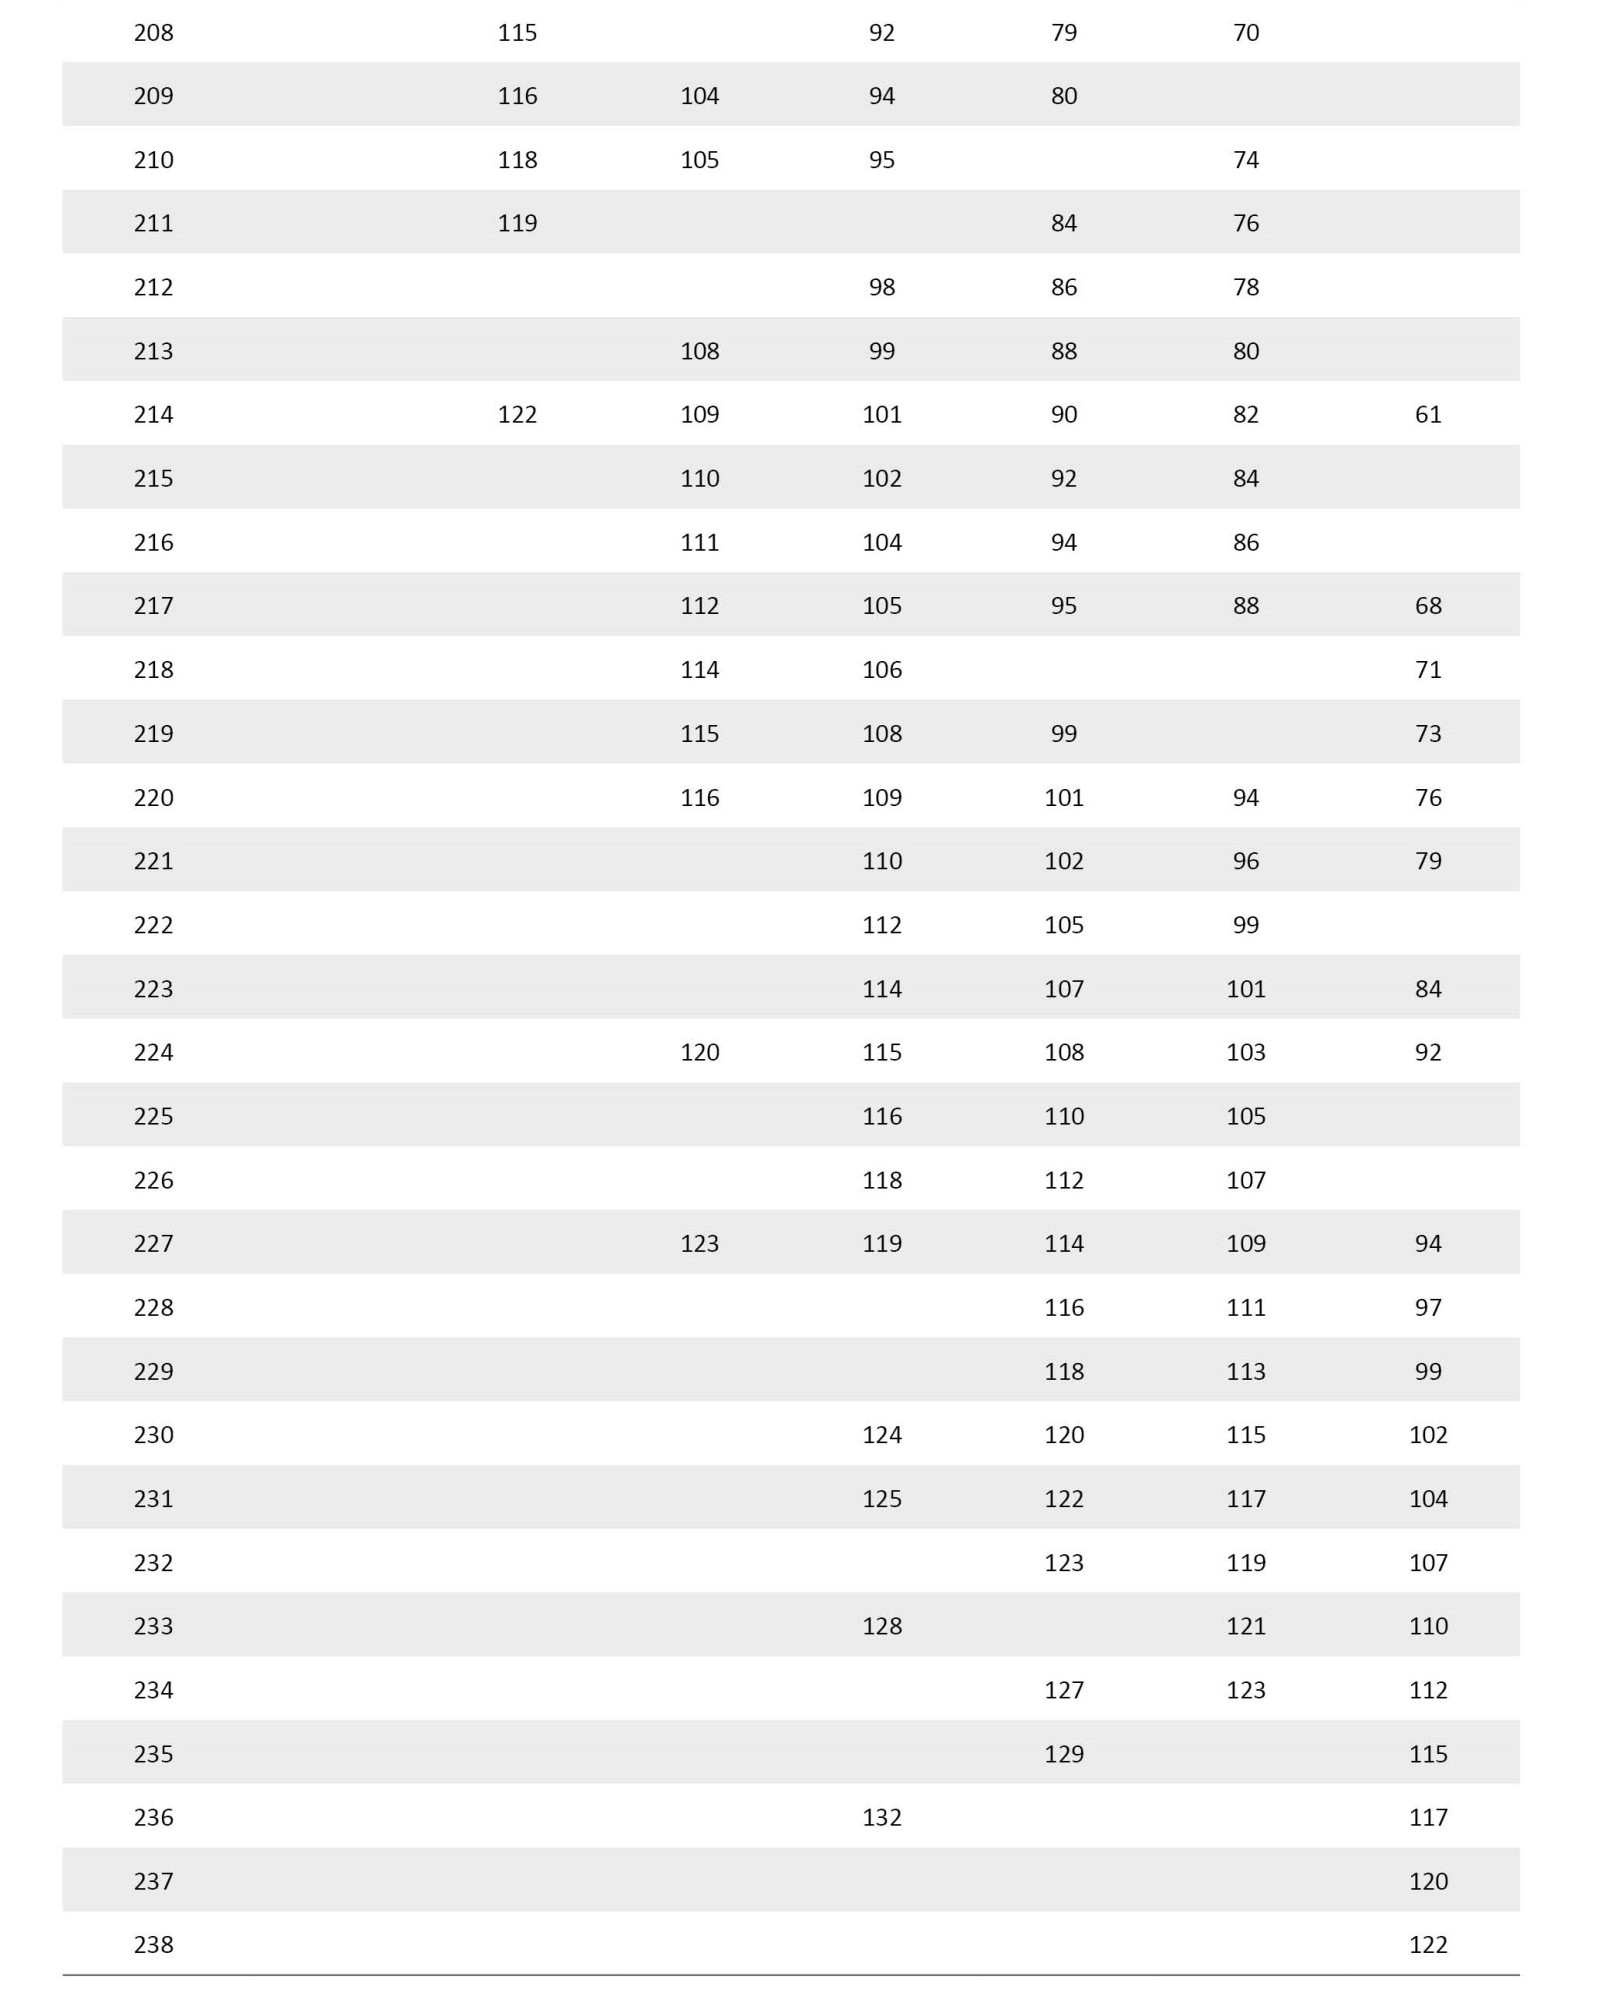
Appendix 2 presents the Z scores of the RPVT-P in Persian language children aged 30-71 months. According to Appendix 2, if the children get a standard score between 90 and 110 based on their raw score, their scores are in the normal range of the RPVT-P.
Stage 2
Table 6 presents the description of the intellectual age, chronological age, and sex of the participants in stage 2.

Table 7 presents the descriptive statistics for the total score of the RPVT-P and t-test results compared to Down syndrome and normal children.

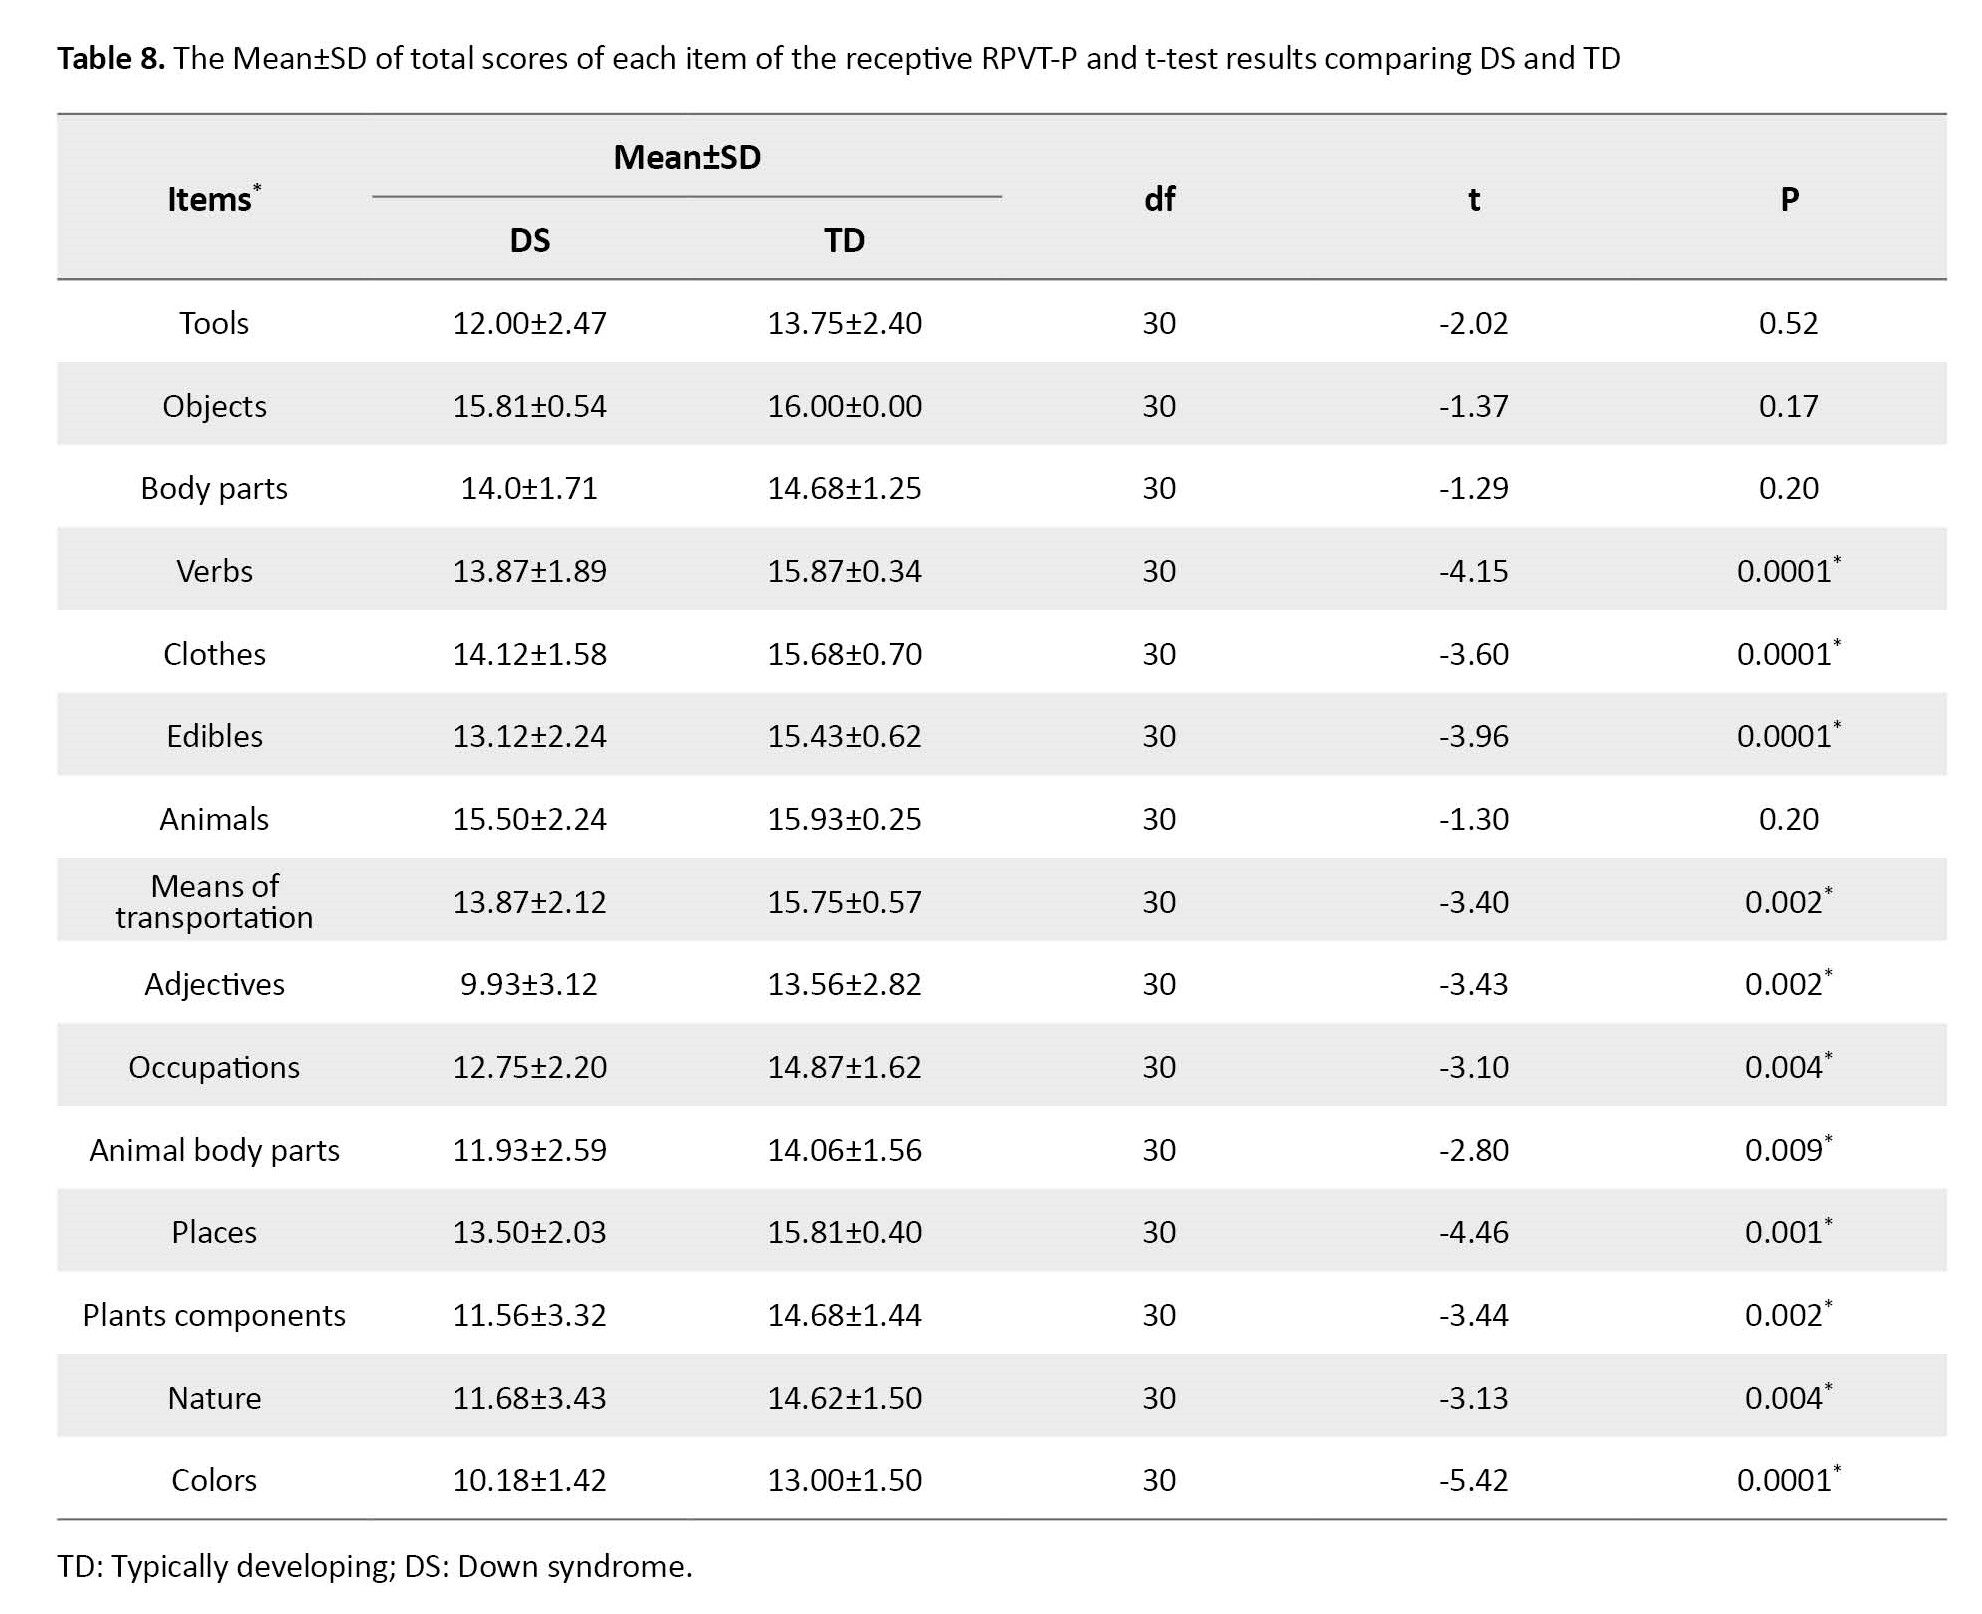
The t-test demonstrated a significant difference between the two groups in the total score of the RPVT-P. Table 8 presents the Mean±SD of total scores of each item of the RPVT-P and t-test results comparing DS and TD.
Discussion
The indication of the adequate and accurate test is its good psychometric properties. Two crucial psychometric properties of a test are reliability and validity. Stability and consistency are two indicators of reliability. Validity describes whether a test measures what it is intended to measure.
Hydarpanahi et al [12] developed the second version of the RPVT-P, which is a computer-based test. They reported sufficient psychometric properties in research on 105 typically developing Persian-speaking children aged 30-71 months. Its psychometric properties are as followed:
The mean values of the content validity ratio and content validity index were 0.91 and 0.93, respectively. A Cronbach’s α of 0.95, an ICC of 0.89 [12].
Statisticians believe that the minimum sample size is 100 people [13]. Because Hydarpanahi et al had a minimum sample size in their study, the present study aimed to report the psychometric properties of the RPVT-P using a good sample size for data analysis. Therefore, 434 normal children aged 30 to 71 months participated in the first stage of our study and the second stage was conducted on 32 children, including DS and TD peers. The results showed Cronbach’s α of 0.825. Hydarpanahi et al reported the value of Cronbach’s α coefficient of 0.95 [12]. Cronbach’s α coefficient shows a degree of internal consistency. Cronbach’s α values between 0.7 and 0.9 have been described as good internal consistency [18]. The Cronbach’s α coefficient values in the current study and Hydarpanahi et al’s study showed that the RPVT-P has good internal consistency.
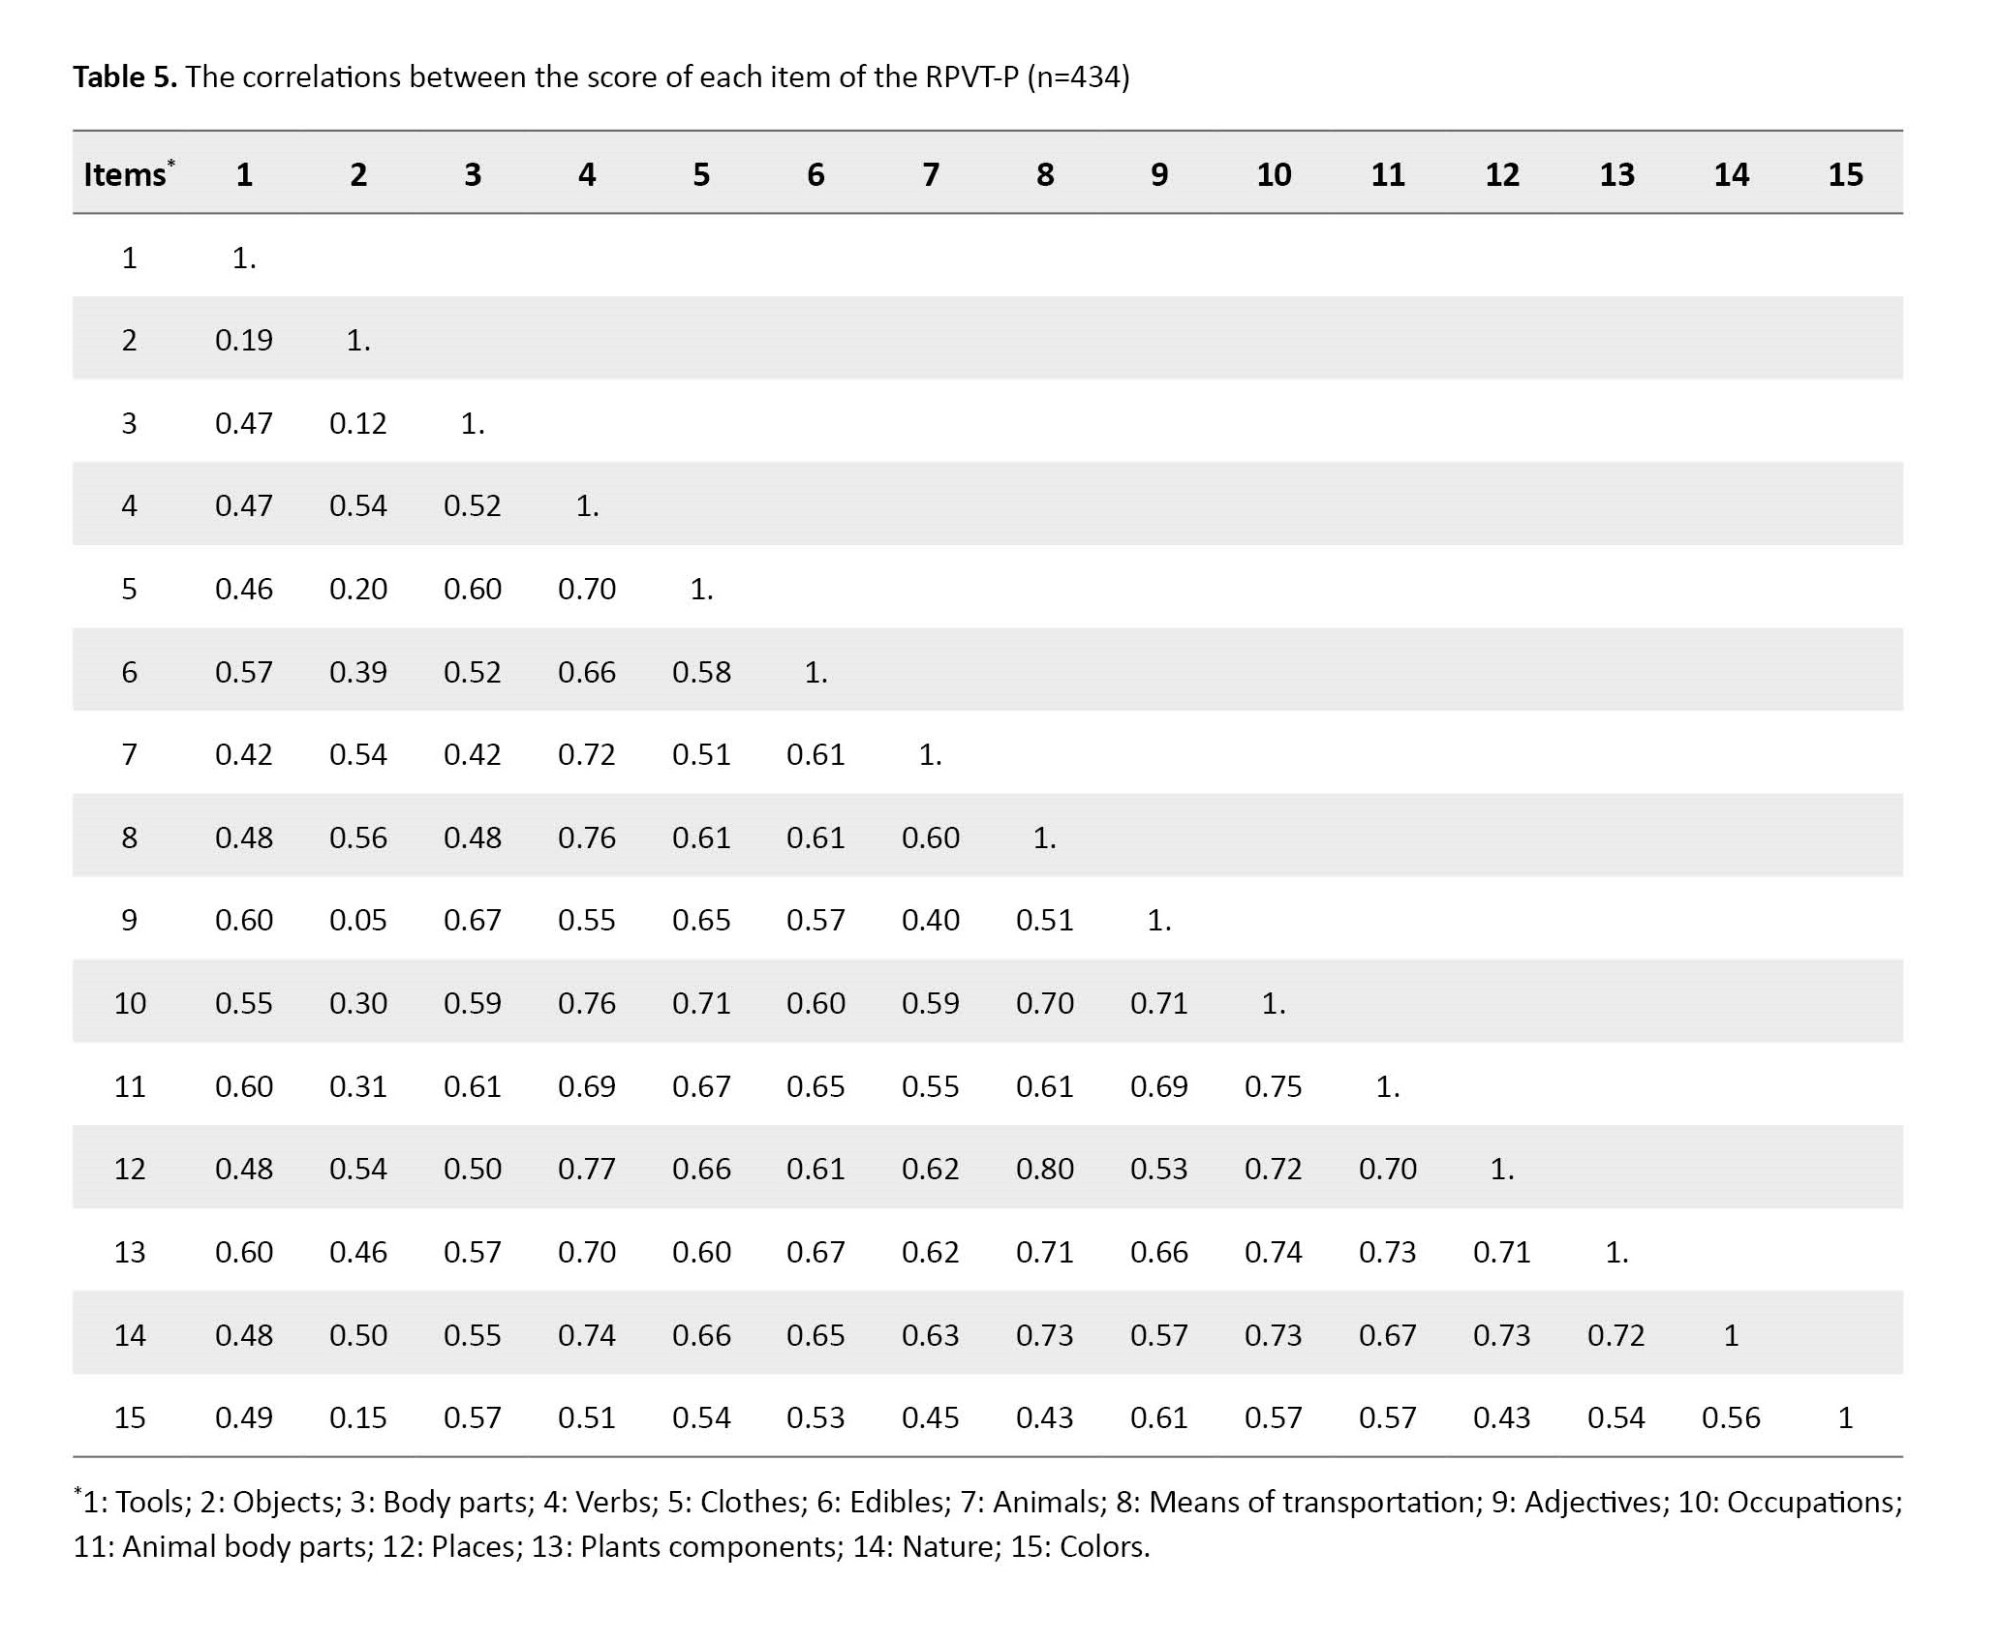
The inter-item correlation matrix for each item ranged from 0.05 to 0.80. The highest value of the coefficient between the score of each item of the RPVT-P was above 0.3. A significant correlation was observed between most items. Based on Cohen’s classification, the values of the correlation coefficient between 0.10 to 0.29 are small, between 0.30 to 0.49, it is medium, and between 0.50 to 1.00, it is high.
The item-total correlation coefficient values ranged from 0.476 to 0.873. The item-total correlation between 0.30 to 0.70 can be considered acceptable [19]. Therefore, the strength of the relationship between each item and the total score of the RPVT-P showed a good level of internal consistency of the RPVT-P.
The range of Cronbach’s α coefficients was 0.811 to 0.822 if the item was deleted. After the deletion of each item, Cronbach’s α did not exceed the total coefficient, indicating the consistency of all items. Cronbach’s α showed that all 15 items significantly contributed to the acceptable internal consistency of the RPVT-P if an item was deleted.
Construct validity was assessed by the correlation between the age and the total score of the RPVT-P. A significant correlation was observed between the total score of the RPVT-P and age. Pearson’s correlation coefficient of r=0.795 (P=0.0001) as a strong positive correlation showed a strong construct validity of the RPVT-P.
In this study, the raw score (total score) of the RPVT-P was converted to standard scores. The standard scores are approximately normally distributed; therefore, not only they can be used in clinical assessment, but also they are valuable tools in research [20]. According to Table A, if the raw scores were calculated between 166 and 176 for children aged 30-35 months, their RPVT-P scores are in the normal range.
Intellectual disabilities and poor speech and language abilities are reported in children with DS [21]. Abbeduto et al reported low-level performance of language development, including expressive, receptive, and syntax in individuals with DS [22]. They used the Peabody picture vocabulary test–4th edition as a standardized norm-referenced test, including nouns, verbs, and adjectives [5] to measure receptive vocabulary. Abbeduto et al reported a significant correlation between chronological age and receptive vocabulary for participants with DS, but the chronological age of the DS group was older than the TD group. They found no differences in verb knowledge between DS and TD control groups [22].
The results of the current study in stage 2 demonstrated a significant difference between the DS and TD peers in the total score of the RPVT-P, which is evidence for the discriminant validity of the RPVT-P.
The current study also compared the item scores of the RPVT-P in DS and TD peers. The result showed that the DS group and TD peers had no difference in item scores, including tools, home appliances, body organs, fruits, and foods that are nouns. A significant difference was observed between the 2 groups in other item scores, including verbs, clothes, animals, vehicles, related to animals, adjectives and opposites, jobs, places, plant words, nature words, and colors.
In the current study, the DS group and TD peers had differences in verbs; however, Abbeduto et al reported no differences in verb knowledge between DS and TD control groups [22].
Conclusion
The results of the current research indicated the acceptable reliability and internal consistency of the RPVT-P. Therefore, the RPVT-P as a tool with sufficient psychometric properties is suitable to measure the ability of preschool Persian-speaking children in receptive vocabulary.
Ethical Considerations
Compliance with ethical guidelines
This study was approved by the Ethics Committee of the Iran University of Medical Sciences, Tehran, Iran (Code: IR.IUMS.REC.1396.31461). All parents signed consent form to participate their children in this study.
Funding
This study was financially supported by the Iran University of Medical Sciences (Grant No.: 1396.31461).
Authors' contributions
Conceptualization: Nahid Jalilevand, Ali Ghorbani and Mohamad Kamali; Methodology: All authors; Data analysis: Nahid Jalilevand, Ali Ghorbani, Mohamad Kamali and Reyhane Mohamadi; Writing–original draft: Nahid Jalilevand, Reyhane Mohamadi; Writing–review & editing: Nahid Jalilevand, Reyhane Mohamadi, Ali Ghorbani and Mohamad Kamali.
Conflict of interest
The authors declared no conflict of interest.
Acknowledgments
We would like to thank all parents and kindergartens employee who cooperated to accomplish the objectives of this study.
References
Word comprehension is one of the essential skills for language development and communication. All words that a person can understand mean receptive vocabulary. In the first months of life, normal toddlers begin to understand words before they start to use words for speaking. By the age of 12 months, toddlers recognize about 20 words but rapidly expand their receptive vocabulary to about 1000 words by age three [1]. Children with language disorders or developmental language disorders have communication problems in early childhood [2], therefore, they should be referred to a speech and language pathologist (SLP). One of the assessment tools is a receptive vocabulary test to determine the children’s word comprehension skills. The SLP assess children to determine their abilities to understand words and whether they need clinical practice to improve word comprehension skills [3]. The clinicians can use a norm-referenced test and compare the client’s scores with the characteristics of normative data [4]. One of the norm-referenced tests for receptive vocabulary assessment is the Peabody picture vocabulary test (PPVT) the 4th edition (PPVT-4), which can be used to evaluate English-speaking adults and children. It consists of 228 items, which are divided into 19 item sets [5]. Many authors who used PPVT in their research concluded that bilingual children’s scores were lower than monolingual peers [6]. Some researchers reported adaptation and psychometric properties of the PPVT in their language, for example, Greek, African, Brazilian Portuguese, and Mexican languages [7-10].
So far, no prior study has been conducted on the Persian version of the PPVT. However, Hasanpour et al developed the first version of RPVT-P for children aged 30-71 months and reported its validity and reliability. The RPV included 240 color pictures (items) divided into 15 subtests, each subtest consisted of 16 pictures. The vocabulary subtests include tools, objects, body parts, verbs, clothes, edibles, animals, means of transportation, adjectives, occupations, animals, body parts, places, plant components, colors, and nature. The first version of RPVT-P was a paper-based; the pictures of vocabulary in the paper were shown to the children by the examiner. Hassanpour et al. reported psychometric properties of the RPVT-P. The study participants included 91 normal children in 7 age groups with an age group of 6 months. A value of 0.909 was reported for Cronbach’s α, indicating good internal consistency. The seven–day test-retest reliability using intra-class correlation (ICC) was estimated at 0.81 considered good reliability. The results of the analysis of variance (ANOVA) test showed a significant difference between the age groups in the mean total score of the RPVT-P (P=0.000). No significant differences were reported between gender and the total scores of the RPVT-P (P>0.05) [11].
Hydarpanahi et al [12] developed the second version of the RPVT-P. The second version of RPVT-P was computer-based, therefore the examiner showed the pictures of vocabulary on a computer to the children. The experts approved the quality of the pictures of the second version of the RPVT-P. The mean content validity ratio and content validity index were 0.91 and 0.93, respectively. In their study, 1.5 typically developing Persian-speaking children aged 30-71 months participated. A statistically significant difference was reported between age groups in the mean total scores of the RPVT-P (P<0.05). A value of 0.95 for Cronbach’s α was reported as a good internal consistency. The value of the ICC for the receptive picture vocabulary test was 0.89. The results demonstrated that the RPVT-P has sufficient psychometric properties. They concluded that the RPVT-P is a suitable tool to assess the receptive vocabulary of children aged 30-71 months [12].
According to most statisticians, the minimum sample size is 100 people [13]. It is recommended that the sample size should not be less than 250 [14]. The current study aims to determine the psychometric properties of the RPVT-P using a convenience sampling method. According to the law of the sample-to-variable ratio, 15 to 20 samples per variable were considered, [15]. Hence, as the number of the RPVT-P subtests (variables) is 15, the maximum acceptable sample size is 300 people. The researchers suggested 300 people as a good sample size for data analysis.
The current study was conducted to evaluate internal consistency (Cronbach’s α coefficient), construct validity, and discriminant validity of the RPVT-P and to compute Z- scores for raw scores (total scores) of the RPVT-P.
Materials and Methods
The current study was designed in 2 stages:
Stage1
Participants
The sample included 434 typically developed Persian-speaking children aged 30-71 months from kindergartens in 3 Iranian cities, Tehran, Rey, and Isfahan.
The inclusion criteria included age between 30 and 71 months, good general health based on age and stage questionnaire [16], Persian language, good verbal communication ability, no history of seizure, motor or visual impairment, cerebral palsy, genetic syndromes based on medical records and SLP informal assessment.
Materials
The second version of the RPVT-P is a computer-based test, including 240 color pictures divided into 15 subtests and each subtest consisted of 16 pictures. The name of each subtest is as followed:
Tools, home appliances, body organs, verbs, clothes, animals, fruits and foods, vehicles, related to animals, adjectives and opposites, jobs, places, plant words, nature words, and colors.
The pictures of the RPVT-P were displayed from labtop screen to each participant by the examiner (Appendix 1 shows one of the pictures of the RPVT-P). In a quiet room, the examiner encouraged the child to show one picture of 4 pictures on a page that he was listening to. If the child pointed with her/his finger correctly, the examiner marked (√) on the test form. The examiner calculated all the correct answers as the total score for each subtest and the total score for all items.
Statistical analysis
The data were analyzed descriptively and inferentially using the skewness and kurtosis values to assess the normality of the data distribution. For a sample size >300, the normality of the data depends on the absolute values of skewness and kurtosis. The skewness value ≤2 and kurtosis value ≤4 were used as reference values to determine data normality [17]. The normal distribution of data was confirmed and parametric statistical tests were used. The statistical significance level was P<0.05.
The internal consistency of the RPVT-P was evaluated by Cronbach’s α coefficient and Cronbach’s α in case of item deletion. The correlation between the items was measured using the Pearson correlation coefficient.
The t-test was used for the difference between the sexes, and Pearson’s correlation coefficient was used to verify the correlation between the variables of age and the total scores RPVT-P. To obtain standard scores, the raw score (total score) of the subjects was converted to the Z score. In this study, the raw score with a mean of 100 and a standard deviation of 15 was converted into a standard score.
A confidence interval of 95% and a significance level of 0.05 were considered. The SPSS software, version 21 was used to analyze.
Stage 2
Stage 2 aimed to evaluate the discriminant validity of the RPVT-P.
Participants
The participants in the second stage of this study included 32 children in 2 groups, group 1: 16 Down syndrome (DS) children aged between 7.3 and 14.4 years compared to 16 normal children in group 2 aged 4-5.9 years, who were matched in terms of general intelligence. The normal developing children have no history of hearing problems, neurological disorders, or speech and language problems. They attended kindergartens in Tehran. The participants with DS were recruited from the Down Syndrome Association in Tehran City, Iran.
The Stanford–Binet intelligence scale test was used to calculate the mental age of children. The children with DS and typically developing (TD) peers were matched for non-verbal mental age based on the Stanford–Binet intelligence scale test.
Statistical analysis
The data were analyzed descriptively and inferentially using the Kolmogorov-Smirnov test to assess the normality of the data distribution. The normal distribution of data was confirmed and parametric statistical tests were used. The statistical significance level was P<0.05. T-test for the difference between the 2 groups in the means total scores of RPVT-P. A confidence interval of 95% and a significance level of 0.05 were considered. The SPSS software, version 21 was used to analyze.
Results
Stage 1
In the first stage of the current study, 227 boys (52.3 %) and 207 girls (47.7%) aged 30-71 months participated. Table 1 presents the descriptive statistics of the age and gender of participants in 6-month intervals.

Table 2 presents the descriptive statistics of the total scores of the RPVT-P for each age group.

Table 3 presents the Mean±SD of the total scores of each item of the RPVT-P for each group. Internal consistency of the RPVT-P was revealed with a Cronbach’s α coefficient of 0.825.

Cronbach’s α did not exceed the total coefficients after removing each item (Table 4).

A significant item-total correlation coefficient was observed (P=0.0001). The Pearson’s correlation coefficient between the total score of the RPVT-P and age was 0.795 (P=0.0001). Table 4 presents a significant correlation coefficient between the score of each item of the RPVT-P and age (P=0.0001). The results showed that the correlation coefficient between the score of each item of the RPVT was statistically significant (P=0.001) ( Table 5).

Appendix 2 presents the Z scores of the RPVT-P in Persian language children aged 30-71 months. According to Appendix 2, if the children get a standard score between 90 and 110 based on their raw score, their scores are in the normal range of the RPVT-P.
Stage 2
Table 6 presents the description of the intellectual age, chronological age, and sex of the participants in stage 2.

Table 7 presents the descriptive statistics for the total score of the RPVT-P and t-test results compared to Down syndrome and normal children.

The t-test demonstrated a significant difference between the two groups in the total score of the RPVT-P. Table 8 presents the Mean±SD of total scores of each item of the RPVT-P and t-test results comparing DS and TD.

Discussion
The indication of the adequate and accurate test is its good psychometric properties. Two crucial psychometric properties of a test are reliability and validity. Stability and consistency are two indicators of reliability. Validity describes whether a test measures what it is intended to measure.
Hydarpanahi et al [12] developed the second version of the RPVT-P, which is a computer-based test. They reported sufficient psychometric properties in research on 105 typically developing Persian-speaking children aged 30-71 months. Its psychometric properties are as followed:
The mean values of the content validity ratio and content validity index were 0.91 and 0.93, respectively. A Cronbach’s α of 0.95, an ICC of 0.89 [12].
Statisticians believe that the minimum sample size is 100 people [13]. Because Hydarpanahi et al had a minimum sample size in their study, the present study aimed to report the psychometric properties of the RPVT-P using a good sample size for data analysis. Therefore, 434 normal children aged 30 to 71 months participated in the first stage of our study and the second stage was conducted on 32 children, including DS and TD peers. The results showed Cronbach’s α of 0.825. Hydarpanahi et al reported the value of Cronbach’s α coefficient of 0.95 [12]. Cronbach’s α coefficient shows a degree of internal consistency. Cronbach’s α values between 0.7 and 0.9 have been described as good internal consistency [18]. The Cronbach’s α coefficient values in the current study and Hydarpanahi et al’s study showed that the RPVT-P has good internal consistency.
The inter-item correlation matrix for each item ranged from 0.05 to 0.80. The highest value of the coefficient between the score of each item of the RPVT-P was above 0.3. A significant correlation was observed between most items. Based on Cohen’s classification, the values of the correlation coefficient between 0.10 to 0.29 are small, between 0.30 to 0.49, it is medium, and between 0.50 to 1.00, it is high.
The item-total correlation coefficient values ranged from 0.476 to 0.873. The item-total correlation between 0.30 to 0.70 can be considered acceptable [19]. Therefore, the strength of the relationship between each item and the total score of the RPVT-P showed a good level of internal consistency of the RPVT-P.
The range of Cronbach’s α coefficients was 0.811 to 0.822 if the item was deleted. After the deletion of each item, Cronbach’s α did not exceed the total coefficient, indicating the consistency of all items. Cronbach’s α showed that all 15 items significantly contributed to the acceptable internal consistency of the RPVT-P if an item was deleted.
Construct validity was assessed by the correlation between the age and the total score of the RPVT-P. A significant correlation was observed between the total score of the RPVT-P and age. Pearson’s correlation coefficient of r=0.795 (P=0.0001) as a strong positive correlation showed a strong construct validity of the RPVT-P.
In this study, the raw score (total score) of the RPVT-P was converted to standard scores. The standard scores are approximately normally distributed; therefore, not only they can be used in clinical assessment, but also they are valuable tools in research [20]. According to Table A, if the raw scores were calculated between 166 and 176 for children aged 30-35 months, their RPVT-P scores are in the normal range.
Intellectual disabilities and poor speech and language abilities are reported in children with DS [21]. Abbeduto et al reported low-level performance of language development, including expressive, receptive, and syntax in individuals with DS [22]. They used the Peabody picture vocabulary test–4th edition as a standardized norm-referenced test, including nouns, verbs, and adjectives [5] to measure receptive vocabulary. Abbeduto et al reported a significant correlation between chronological age and receptive vocabulary for participants with DS, but the chronological age of the DS group was older than the TD group. They found no differences in verb knowledge between DS and TD control groups [22].
The results of the current study in stage 2 demonstrated a significant difference between the DS and TD peers in the total score of the RPVT-P, which is evidence for the discriminant validity of the RPVT-P.
The current study also compared the item scores of the RPVT-P in DS and TD peers. The result showed that the DS group and TD peers had no difference in item scores, including tools, home appliances, body organs, fruits, and foods that are nouns. A significant difference was observed between the 2 groups in other item scores, including verbs, clothes, animals, vehicles, related to animals, adjectives and opposites, jobs, places, plant words, nature words, and colors.
In the current study, the DS group and TD peers had differences in verbs; however, Abbeduto et al reported no differences in verb knowledge between DS and TD control groups [22].
Conclusion
The results of the current research indicated the acceptable reliability and internal consistency of the RPVT-P. Therefore, the RPVT-P as a tool with sufficient psychometric properties is suitable to measure the ability of preschool Persian-speaking children in receptive vocabulary.
Ethical Considerations
Compliance with ethical guidelines
This study was approved by the Ethics Committee of the Iran University of Medical Sciences, Tehran, Iran (Code: IR.IUMS.REC.1396.31461). All parents signed consent form to participate their children in this study.
Funding
This study was financially supported by the Iran University of Medical Sciences (Grant No.: 1396.31461).
Authors' contributions
Conceptualization: Nahid Jalilevand, Ali Ghorbani and Mohamad Kamali; Methodology: All authors; Data analysis: Nahid Jalilevand, Ali Ghorbani, Mohamad Kamali and Reyhane Mohamadi; Writing–original draft: Nahid Jalilevand, Reyhane Mohamadi; Writing–review & editing: Nahid Jalilevand, Reyhane Mohamadi, Ali Ghorbani and Mohamad Kamali.
Conflict of interest
The authors declared no conflict of interest.
Acknowledgments
We would like to thank all parents and kindergartens employee who cooperated to accomplish the objectives of this study.
References
- Owens Jr RE. Language development: An introduction. Boston:Pearson Education; 2015. [Link]
- Verhoeven L, Van Balkom H. Classification of developmental language disorders: Theoretical issues and clinical implications. New York: Psychology Press; 2003. [DOI:10.4324/9781410609021]
- Miller J, Paul R. The clinical assessment of language comprehension. Baltimore: Paul H Bookes; 1995. [Link]
- Turner SM, DeMers ST, Fox HR, Reed GM. APA’s guidelines for test user qualifications: An executive summary. American Psychologist. 2001; 56(12):1099-113. [DOI:10.1037/0003-066X.56.12.1099]
- Dunn LM, Dunn DM. Peabody Picture Vocabulary Test--Fourth Edition. Circle Pines, MN: American Guidance Service; 2007. [DOI:10.1037/t15144-000]
- Blom E, Boerma T, Bosma E, Cornips L, van den Heuij K, Timmermeister M. Cross-language distance influences receptive vocabulary outcomes of bilingual children. First Language. 2020; 40(2):151-71. [DOI:10.1177/0142723719892794]
- Simos PG, Sideridis GD, Protopapas A, Mouzaki A. Psychometric evaluation of a receptive vocabulary test for Greek elementary students. Assessment for Effective Intervention. 2011; 37(1):34-49. [DOI:10.1177/1534508411413254]
- Pakendorf C, Alant E. Culturally valid assessment tools: Northern Sotho translation of the peabody picture vocabulary test-revised. South African Journal of Communication Disorders. 1997; 44(1):3-12. [DOI:10.4102/sajcd.v44i1.223]
- Capovilla FC, Capovilla AGS. [Desenvolvimento lingüístico na criança dos dois aos seis anos: Tradução e estandardização do Peabody Picture Vocabulary Test de Dunn & Dunn, e da Language Development Survey de Rescorla (Portuguese)]. Ciência Cognitiva: Teoria, pesquisa e aplicação. 1997; 1(1):353-80. [Link]
- Simon AJ, Joiner LM. A Mexican version of the Peabody picture vocabulary test. Journal of Educational Measurement. 1976; 13(2):137-43. [DOI:10.1111/j.1745-3984.1976.tb00004.x]
- Hassanpour N, Jalilevand N, Masumi E, Ghorbani A, Kamali M. [Development of a picture receptive vocabulary test and evaluation of its validity & reliability for normal 36-71 months Persian Children (Persian)]. Journal of Paramedical Sciences & Rehabilitation. 2015; 4(3)34-43. [Link]
- Heydarpanahi S, Ghorbani A, Jalilevand N, Kamali M. Revising the first version of receptive picture vocabulary test and design the first version of expressive picture vocabulary test based on it for normal Persian-speaking children aged 30 to 71 months. MEJDS. 2023. [Unpublished article]
- Mundfrom DJ, Shaw DG, Ke TL. Minimum sample size recommendations for conducting factor analyses. International Journal of Testing. 2005; 5(2):159-68. [DOI:10.1207/s15327574ijt0502_4]
- MacCallum RC, Widaman KF, Zhang S, Hong S. Sample size in factor analysis. Psychol Methods. 1999; 4(1):84-99. [DOI:10.1037/1082-989X.4.1.84]
- Memone MA, Ting H, Cheah JH, Thurasamy R, Chuah F, Huei Cham T. Sample size for survey research: Review and recommendation. Journal of Applied Structural Equation Modeling. 2020; 4(2):i-xx. [DOI:10.47263/JASEM.4(2)01]
- Vameghi R, Sajedi F, Kraskian Mojembari A, Habiollahi A, Lornezhad HR, Delavar B. Crosscultural adaptation, validation and standardization of ages and stages questionnaire (ASQ) in Iranian children. Iranian Journal of Public Health. 2013; 42(5):522-8. [PMID]
- Kim HY. Statistical notes for clinical researchers: Assessing normal distribution (2) using skewness and kurtosis. Restorative Dentistry & Endodontics. 2013; 38(1):52-4. [DOI:10.5395/rde.2013.38.1.52] [PMID] [PMCID]
- Souza AC, Alexandre NMC, Guirardello EB. Psychometric properties in instruments evaluation of reliability and validity. Epidemiologia e Servicos de Saude. 2017; 26(3):649-59. [DOI:10.5123/S1679-49742017000300022] [PMID]
- Ferketich S. Focus on psychometrics. Aspects of item analysis. Research in Nursing & Health. 1991; 14(2):165-8. [DOI:10.1002/nur.4770140211] [PMID]
- Bishop DVM. Test for reception of grammar version 2(TROG -2). London: Pearson Assessment; 2003. [Link]
- Andreou G, Katsarou D, Language learning in children with down syndrome (DS): Receptive and expressive morphosyntactic abilities. Procedia - Social and Behavioral Sciences. 2013; 93:921-4. [DOI:10.1016/j.sbspro.2013.09.304]
- Abbeduto L, Murphy MM, Cawthon SW, Richmond EK, Weissman MD, Karadottir S, et al. Receptive language skills of adolescents and young adults with down or fragile X syndrome. American Journal on Mental Retardation. 2003; 108(3):149-60. [PMID]
Type of Study: Research |
Subject:
Speech Therapy
Received: 2023/02/13 | Accepted: 2023/05/31 | Published: 2022/02/3
Received: 2023/02/13 | Accepted: 2023/05/31 | Published: 2022/02/3


